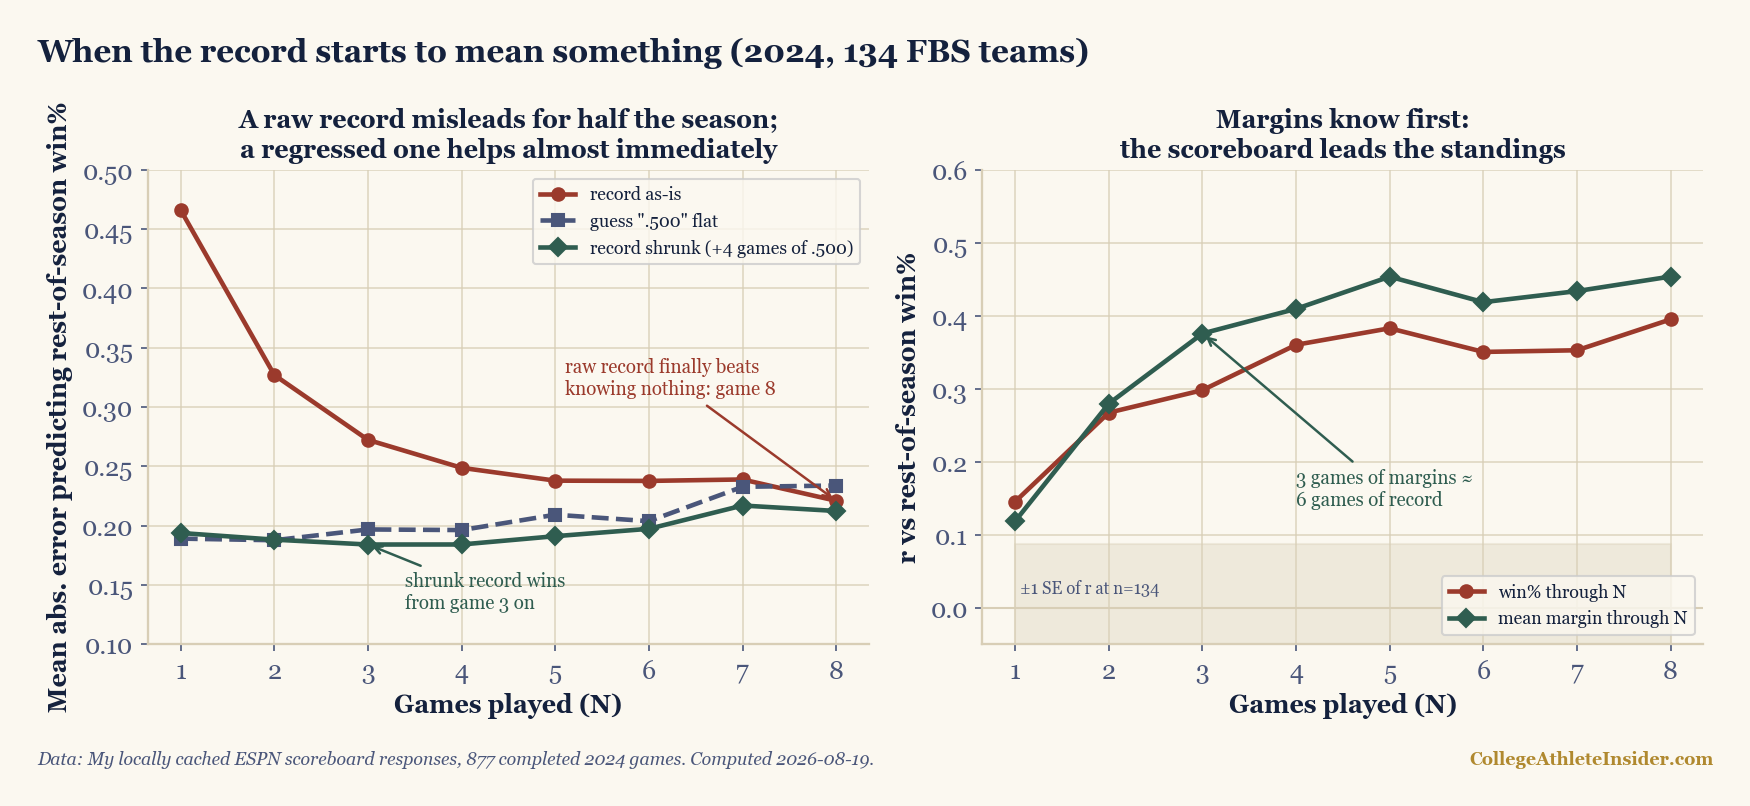
Two weeks from now the sport starts again, and within a month your feed will fill with 4–0 teams that have “announced themselves” and 1–3 teams whose coaches are done. So before the noise arrives I ran the question through the 877 completed 2024 games in this site’s cache: after N games, how well does a team’s record actually predict the rest of its season? The answer is rude. Used as-is, the record-so-far predicts rest-of-season winning worse than a flat guess of .500 until game 8 — November football — and the fix isn’t waiting, it’s shrinking: blend the record with four imaginary games of .500 and it beats knowing-nothing from game 3 on. Meanwhile the scoreboard is ahead of the standings the whole way: three games of scoring margins carry about as much rest-of-season signal as six games of wins and losses.
The test, stated honestly
For each of the 134 FBS teams (the house 8+-appearance proxy), line up its cached games in Eastern-time order. Take the first N as known, and try to predict its winning percentage over everything after N — requiring at least four remaining games so the target is a real sample. Score predictions by mean absolute error. Three predictors compete: the team’s raw win% through N; the number you’d use knowing nothing, a flat .500; and the shrunk record — the record plus four phantom games of .500, which is (W + 2) / (N + 4). N runs 1 through 8; beyond that the only teams with enough games left are the championship-and-playoff tail, a selection effect rather than a sample, so the analysis stops where the sample stays whole (n = 132–134 throughout).
| Games played | MAE: raw record | MAE: flat .500 | MAE: shrunk record | r: record | r: mean margin |
|---|---|---|---|---|---|
| 1 | 0.466 | 0.189 | 0.194 | 0.15 | 0.12 |
| 2 | 0.327 | 0.188 | 0.188 | 0.27 | 0.28 |
| 3 | 0.272 | 0.197 | 0.184 | 0.30 | 0.38 |
| 4 | 0.249 | 0.196 | 0.184 | 0.36 | 0.41 |
| 5 | 0.238 | 0.209 | 0.191 | 0.38 | 0.45 |
| 6 | 0.238 | 0.204 | 0.197 | 0.35 | 0.42 |
| 7 | 0.239 | 0.233 | 0.217 | 0.35 | 0.43 |
| 8 | 0.221 | 0.234 | 0.212 | 0.40 | 0.45 |
Why a real record loses to a fake number
How can a team’s actual results predict its future worse than a number containing no information? Because a young record is an extreme number. After one game every team in America is 1.000 or 0.000, and no team on earth plays .000 football the rest of the way; the raw record’s error at N = 1 (0.466) is almost entirely self-inflicted overstatement. Rest-of-season win rates cluster toward the middle, so a predictor that lives at the edges pays for its confidence every single week. This is regression to the mean doing what it always does, and college football makes it worse than most sports: the early schedule is stuffed with buy games that inflate records without discriminating between teams — opening week alone was 61% FCS visitors in this cache.
The shrinkage estimator is nothing but that insight wearing arithmetic. Four phantom games of .500 is a crude prior — no recruiting composite, no returning production, no coach’s seat temperature — and it still beats both the raw record and the flat guess from game 3 onward. The lesson isn’t that this exact k is sacred; it’s that any respect paid to the middle beats treating a September record as a measurement.
4–0 means “pretty good,” not “great”
The same cache, cut the way fans actually talk. 23 teams started 2024 four-and-oh. Their combined record the rest of the way was .640 football — clearly good, nowhere near their undefeated advertising. The five 0–4 teams played .325 afterward; the thirty-one 2–2 teams, .524. So a perfect month bought about 12 points of future win rate over mediocrity, and a winless one cost about 20. Real signal, heavily discounted — and the tails supplied the object lessons. Utah started 4–0 and won 12% of its remaining games. New Mexico started 0–4 and played .620 the rest of the way — better than the average 4–0 starter. Neither team was lying in September; September itself just doesn’t say much.
The scoreboard leads the standings
The right panel is the finding I’d actually carry into this season. At every horizon from three games on, mean scoring margin through N predicts rest-of-season winning better than win% through N does — r = 0.38 vs 0.30 at three games, 0.45 vs 0.38 at five. Wins are a one-bit summary of a forty-point information stream; margins keep what the standings throw away, which is why Pythagorean expectation works and why gaudy one-score records regress. The cleanest 2024 illustration: Tulane sat 1–2 after three games — while outscoring opponents by 10 a game. The record said struggling; the margin said good team with hard losses. Tulane played .800 football the rest of the season. (Margins are not an oracle — they run through the same buy-game inflation as everything else in September — but they are consistently the better half of the scoreboard.)
One caveat belongs in the open: this is one season’s worth of teams, so every correlation above wears a standard error of about 0.09, and the exact crossover points would wobble in another year. What wouldn’t wobble is the ordering — extreme early records overstating themselves, shrinkage repairing them, margins leading wins — because those aren’t facts about 2024; they’re facts about small samples, and every September is one. The poll piece measured how long voters cling to August opinions; this is the other half of that trade — how long the results themselves deserve to be doubted.
What to do with this in September 2026
Three habits, all free. When a team starts 4–0, mentally book it as .640. When a record and its margins disagree, trust the margins — three weeks of them outrank six weeks of standings. And when you’re tempted to project anyone in September, remember the flat .500 guess out-predicted every raw record in America until November. The record starts meaning something around game three — but only after you’ve taught it some humility first.