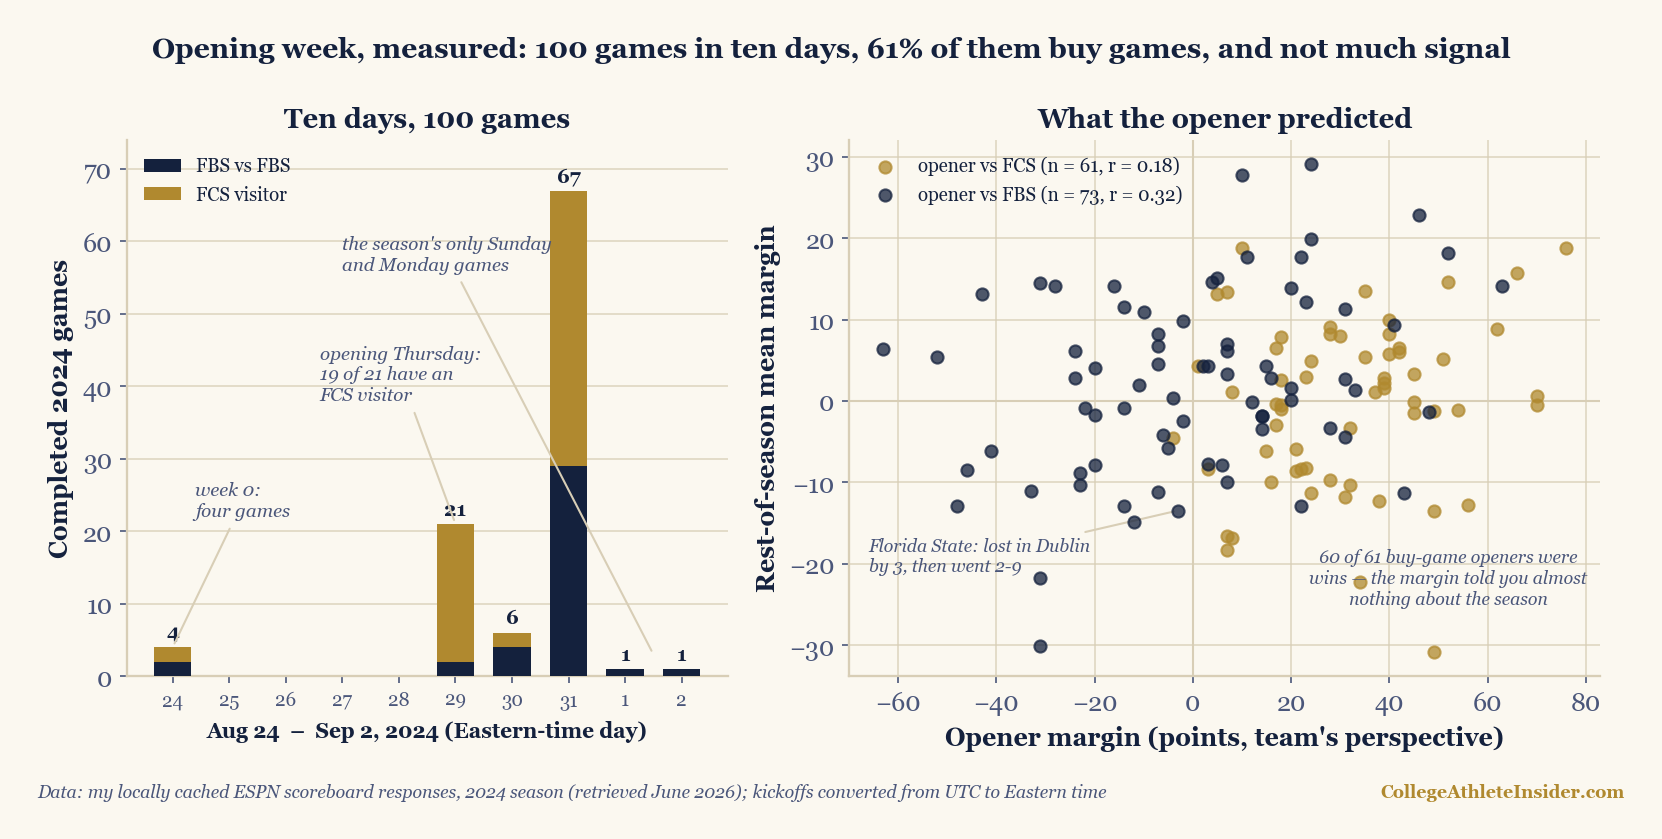
Thirteen days from this article’s date, on August 29, the 2026 college football season opens in Dublin. Before it does, I wanted to know what an opening week actually is — not the poster version, the measured one — so I pulled the 877 completed 2024 games in this site’s cache and drew the portrait: 100 games in ten calendar days, 61 of them FCS buy games, four on neutral fields, and the real FBS-vs-FBS matchups running ten percentage points more blowouts than the rest of the season. The week you watch hardest is the week the scores mean least, and that is measurable too: a team’s opener margin explained about 10% of its rest-of-season scoring margin when the opponent was FBS, and close to nothing when it wasn’t.
Ten days, one hundred games
The 2024 season began twice. Week 0, August 24, was a four-game curiosity: Florida State–Georgia Tech in Dublin, Montana State at New Mexico, SMU at Nevada, Delaware State at Hawai’i. Week 1 was the flood — 96 games from Thursday, August 29 through Labor Day Monday: 21 on opening Thursday, six on Friday, 67 on opening Saturday (the season’s densest single day), then one game each on Sunday and Monday. Those last two — USC–LSU in Las Vegas and Boston College at Florida State — were the only Sunday and Monday games in the entire cached season, a fact the weeknight audit computes independently: television buys exclusive windows in week 1 that exist nowhere else on the calendar. All dates are Eastern time — ESPN stamps kickoffs in UTC, which moves 205 of the 877 games a calendar day if you forget to convert; the house lesson, re-checked every build.
Week 0 was the season in miniature: a buy-game upset (Montana State 35, New Mexico 31, by a visitor that ended its year in the FCS title game), a neutral-site classic that was also, oddly, a conference game (Georgia Tech 24, Florida State 21 — an ACC game the feed flags neutral), and two ordinary tune-ups. One of those four results turned out to be the truest thing anyone learned all week. More on Dublin below.
What the slate is made of
Classify every opening-window game with the house FBS proxy (8+ cached appearances, cross-checked on conference ids) and the mix is lopsided: 61 of the 100 games had an FCS visitor. The rest of the season — September 3 through the December playoff games — held 60. Opening week contained more buy games than the other three and a half months combined. Opening Thursday was the extreme case: 19 of its 21 games were FBS-vs-FCS. The buy-game audit owns that product’s margins and economics; its week-ending-Saturday bucket counts 59 of 94 (62.8%) in week 1 proper, my ten-day calendar window says 61 of 100 — both recomputed at every build, different definitions, same story.
The real games play uglier than midseason
Strip out the buy games and the 39 FBS-vs-FBS openers should be the good stuff. By final score, they were the season’s roughest football. Their average margin was 20.6 points (SE 2.5) against 16.2 for FBS-vs-FBS games the rest of the way; the medians are 20 and 13. Only 28.2% finished inside one score, versus 38.7% from September 3 onward, while 43.6% were three-score blowouts, versus 33.8% — and that is with every buy game already removed. Six of the 39 were decided by 35+, including Alabama 63–0 over Western Kentucky and Texas 52–0 over Colorado State, shutout margins the margin census files deep in its right tail. Openers are scheduled years out, with no conference parity to flatten them — and whatever the cause, in this cache opening week’s “real” games were less competitive than midseason football, not more.
They were also harder to call. Define the “better team” honestly — the cache has no rankings, so I use each team’s full-season per-game scoring margin with the game in question excluded, the same retrospective yardstick the weeknight audit used — and the better 2024 team won only 24 of 39 openers (61.5%, SE 7.8), against 71.2% over the rest of the season. Home teams underperformed their season norm too: 20 of 36 non-neutral openers (55.6%) went to the host, versus the 59.4% season baseline. Small samples, honest error bars — but the direction is consistent: more blowouts and more upsets at once, which is exactly what you’d expect from the week when matchup quality varies most and everyone knows least.
The kickoff classic, counted
The feed flags four of the 100 opening-window games neutral-site: 4.0%, against 1.3% (10 of 763) from September 3 through November 30. Three are the genuine article — manufactured marquee events on rented turf: Florida State–Georgia Tech in Dublin, Clemson–Georgia in Atlanta, USC–LSU in Las Vegas. The fourth is a quirk: Arkansas–Arkansas-Pine Bluff carries the neutral flag with Arkansas still the designated home side. The mid-season neutrals are a different species entirely — fixed-site rivalry fixtures like Texas–Oklahoma and Florida–Georgia. The kickoff classic is opening week’s own invention, and in 2024 it delivered one competitive game in three: Georgia won by 31, USC by 7, Georgia Tech by 3.
What the opener predicted about 2024
Here is the part I actually wanted. Take all 134 FBS teams and split them by their first cached game: 97 won, 37 lost. The winners played 53.2% (SE 2.2) football the rest of the way; the losers 46.0% (SE 3.6) — a 7.2-point gap with a standard error of 4.3, barely distinguishable from nothing in one season. The signal sharpens only when the opener was real: the 73 teams that opened against FBS opposition split 37–36, and there the winners’ rest-of-season win rate was 58.9% against the losers’ 46.0% (a 12.9-point gap, SE 5.1), with rest-of-season margins of +5.8 versus −1.4. As a continuous measure, opener margin correlated with rest-of-season margin at r = 0.32 for FBS openers — about 10% of variance — and r = 0.18 for buy-game openers, where 60 of the 61 FBS sides won and the scoreboard mostly measured how long the starters stayed in.
The week’s truest result was its very first: Georgia Tech over Florida State in Dublin. FSU went 2–12 in the cache; Boston College beating them on Labor Day Monday was, retrospectively, the better team winning. The week’s most misleading result was its biggest: Georgia 34, Clemson 3 — yet Clemson finished 2024 with the better per-game scoring margin (that game excluded), so my yardstick scores the 31-point loser as the better team. Both things are worth holding at once on August 29: opening week contains real information, and a single scoreline — even a huge one — is a terrible way to extract it. How fast the polls actually incorporated results like these is its own measured piece; this is the raw material that process was working with.
Watching 2026’s opening week
As of this writing, the 2026 calendar runs later than 2024’s did: week 0 is Saturday, August 29 — headlined by North Carolina–TCU at Aviva Stadium in Dublin, the same stage 2024’s week 0 used — and week 1 runs Thursday, September 3 through Labor Day, September 7, with the first full Saturday on September 5 (Clemson at LSU) and Notre Dame–Wisconsin at Lambeau Field on Sunday the 6th. Expect the 2024 shape to repeat, because it is structural: a small week-0 slate with one made-for-TV centerpiece, a Thursday wearing an FCS costume, a wall of buy games on the first two Saturdays, and kickoff classics renting neutral stadiums. When the upsets come, remember what one season of data says: the openers that mean something are the FBS-vs-FBS ones, they miss more often than midseason games do, and even they explain about a tenth of what follows.
Where this can mislead you
- One cached season. Every number is 2024. Opening-week samples are small by construction — 39 FBS-vs-FBS games, 37 opener-losers — and the standard errors quoted above are wide enough to deserve reading.
- “Better team” is retrospective and schedule-blind. Full-season mean margin ignores who you played; it is why it can rate 34–3 Georgia below Clemson. The cache has no rankings, so no claim here means “ranked upset.”
- “Week” is a definition. My window is the calendar span August 24–September 2; the buy-game piece buckets by week-ending Saturday. Both versions are recomputed at build time.
- 2024’s calendar is not 2026’s. The 2026 season opens a week later and reportedly with a larger week-0 slate; “100 games in ten days” describes 2024, not a law.
- Prediction here is correlation. An opener margin is partly the schedule itself — teams that schedule hard openers differ from teams that don’t, and r = 0.32 makes no causal claim.
Reproduce it
The chart above is rebuilt from the cache on every charts build by charts/chart_week_one.py, which reuses the weeknight audit’s loader (UTC-to-Eastern conversion included), classifies teams by the 8+-appearance proxy, and recomputes every number in this article — the day-by-day census, the 61/39 mix, the margin and upset comparisons, the neutral-site counts, and the opener-to-rest-of-season correlations — warning at build time if the cache stops reproducing any of them. The core:
window = games with ET date <= Sep 2       # n = 100 (week 0: 4, week 1: 96)
mix: 61 FCS visitors, 39 FBS-vs-FBS        # rest of season: 60 buy games
FF openers: |margin| 20.6 vs 16.2 rest     # blowouts 43.6% vs 33.8%
better season team won: 61.5% vs 71.2%     # openers miss more
opener margin vs rest margin: r 0.32 (FBS opp), 0.18 (FCS opp)
Sources & further reading
- Data: my locally cached ESPN public-API scoreboard responses (
scripts/cache/, retrieved June 2026; provenance indata_layer/SOURCE.txt) — 877 completed 2024 games, finals, kickoff timestamps, and venue flags. Kickoffs converted from UTC to Eastern time for every calendar claim. - Every figure above is recomputed from that cache at build time by
charts/chart_week_one.py, including the cross-checks against the weeknight and buy-game pieces’ published numbers. - 2026 dates and openers verified against FBSchedules.com’s 2026 schedule and Fox Sports’ 2026 week 0/1 guide (both accessed August 2026); dates can move, hence “as of this writing.”
- Related: the FCS buy game, measured (the 61% of this slate, and its margins and economics), weeknight football, measured (the loader this piece reuses, and the day-of-week census), how fast results beat the preseason poll (what voters did with these results), and the margin census.