Tell me how many points a team scored and how many it allowed all season, and I will tell you its record more accurately than its record tells you how good it is. That sounds like a paradox and it isn't. A won-lost record bakes in every one-score bounce, every recovered fumble, every kick that drifted inside the upright — the luck that doesn't repeat. Points scored and points allowed are a bigger, calmer sample, and a formula borrowed from baseball turns them straight into an expected win percentage. I ran it on the entire 2024 FBS season, and it matched real win totals within about one game per team while quietly flagging exactly which teams were living on luck.
The formula is Bill James's Pythagorean expectation, named because its original form looked like the Pythagorean theorem. In its general form:
expected win% = PFx ÷ (PFx + PAx)
where PF is points scored, PA is points allowed, and x is an exponent fit to the sport. Baseball uses about 1.83; the NFL and college football sit near 2.37. That single exponent is the sport's personality in a number: the higher it is, the more a given scoring edge translates into wins.
What the curve says before you touch any data
You can read the whole idea off the formula without a single game. Set the exponent to 2.37 and feed it ratios of points-for to points-against:
| PF / PA | Expected win% | Wins in a 12-game season |
|---|---|---|
| 1.00 (even) | 50.0% | 6.0 |
| 1.10 | 55.6% | 6.7 |
| 1.25 | 62.9% | 7.6 |
| 1.50 | 72.3% | 8.7 |
| 2.00 | 83.8% | 10.1 |
| 2.50 | 89.8% | 10.8 |
| 3.00 | 93.1% | 11.2 |
Even scoring gives you a coin flip, as it should. Outscore your opponents by 25% on the year and the formula expects you to win about 63% of your games — roughly eight of twelve. Double them up and you should win about ten. The curve is steep in the middle and flattens at the ends, which matches intuition: the difference between even and a 25% edge is huge; the difference between doubling and tripling your opponents barely moves the needle, because you were already winning almost everything.
Does it actually work? The 2024 season, checked
Formulas are cheap. I took the final scores of every completed 2024 FBS game in my cache and, for each of the 134 teams that played a full-length schedule, computed its expected win percentage from season points scored and allowed, multiplied by games played to get expected wins, and compared that to reality. The formula's expected win percentage correlated with actual win percentage at r = 0.905 — a very tight relationship. The typical miss was 0.88 wins in absolute terms (root-mean-square error 1.11). A one-number-in, one-number-out formula with no schedule adjustment, no play-by-play, no roster information, predicted a team's win total to within about a game. That is the finding: point differential is most of what a record is.
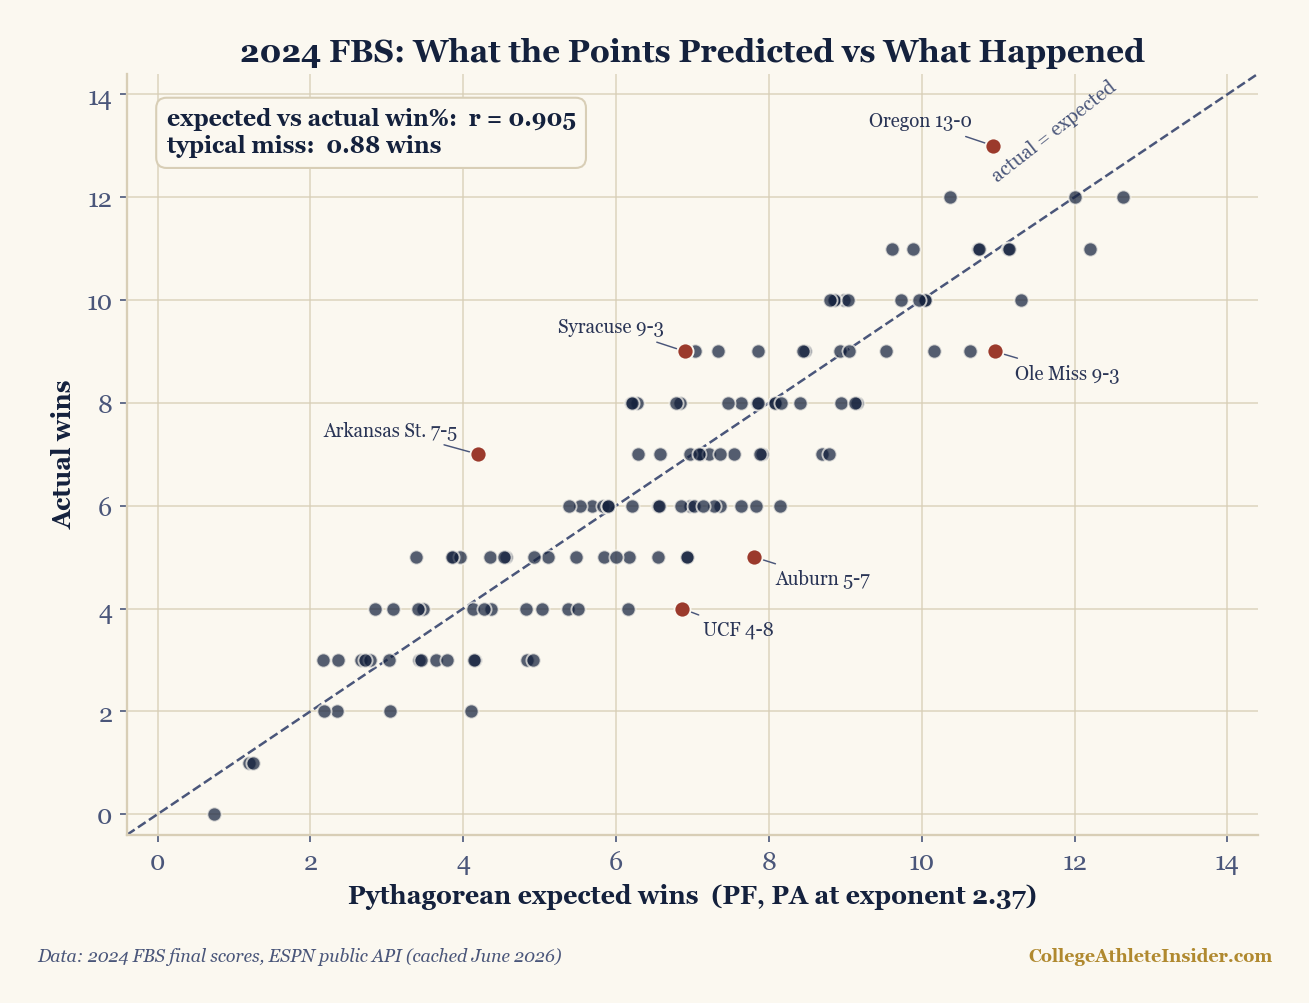
The interesting part is where it misses, because the misses aren't random — they're a luck detector. A team that won far more than its points say is a team that cleaned up in close games, and close-game records barely repeat. Here are the biggest gaps in both directions from 2024:
| Team | Record | PF | PA | Expected wins | Wins − expected |
|---|---|---|---|---|---|
| Arkansas State | 7–5 | 298 | 387 | 4.2 | +2.8 |
| Syracuse | 9–3 | 391 | 344 | 6.9 | +2.1 |
| Oregon | 13–0 | 467 | 231 | 10.9 | +2.1 |
| … | |||||
| Ole Miss | 9–3 | 450 | 167 | 11.0 | −2.0 |
| Auburn | 5–7 | 333 | 256 | 7.8 | −2.8 |
| UCF | 4–8 | 365 | 323 | 6.9 | −2.9 |
Read the bottom of that table and you find the teams everyone spent the fall calling underachievers. UCF outscored its opponents on the year and finished 4–8; Pythagorean says a 365-to-323 differential is worth about seven wins, so the Knights left roughly three wins on the field in close games. Auburn, 5–7 with a positive point differential, is the same story. Ole Miss went 9–3 while outscoring people 450 to 167 — a differential that screams eleven-win team — and dropped three games it statistically had no business losing. These are not bad teams that got exposed. They are good teams that lost the coin flips, and the formula is telling you to expect them to bounce back.
The top of the table is the mirror image, and the marquee name is instructive. Oregon went 13–0 and was, by point differential, about a two-win overachiever — the formula expected an unbeaten-caliber team to have lost a game or two along the way. That is not an insult; it is a caution. An undefeated record built partly on winning the tight ones is more fragile than the same differential spread into comfortable wins, which is precisely why a perfect record is worth reading with a raised eyebrow.
The champion underachieved its own dominance
Ohio State, the eventual national champion, is the cleanest teaching case in the whole dataset. My cache runs through December 21 — the regular season plus the playoff opener, 13 Buckeye games, before the quarterfinal run to the title. Across those 13 games the scoring margin was so lopsided that Pythagorean expected about 12 wins — and they won 11, dropping two by a combined four points. A title team that, if anything, underperformed its point differential. The record said “two losses, can't win the big one.” The point differential said “one of the best teams in the country having its two unluckiest days.” The playoff agreed with the point differential. I broke that season down snap by snap in yards per play built a champion, and Pythagorean reaches the same verdict from thirty thousand feet: don't trust the record over the margin.
Where it breaks
Pythagorean expectation is a blunt instrument, and honesty requires the caveats:
- It has no idea who you played. Points for and against are unadjusted. A team that ran up 45 a game on a cupcake schedule looks identical to one that did it against the SEC. The whole point of strength-of-schedule adjustment is to fix exactly this, and Pythagorean skips it. Use it to compare a team to its own record, not to rank the country.
- Garbage time inflates the blowout artists. Points scored up 35 in the fourth quarter count the same as points that mattered, so teams that pour it on late get overrated. This is why serious efficiency work strips garbage time before counting anything.
- The exponent is a fit, not a law. The 2.37 is chosen to minimize error across many seasons; at a ratio of 1.5, using 2.0 instead gives 69% and using 2.7 gives 75%, so your exact number depends on a constant that was reverse-engineered from data. Take the estimate to within a game, not to the decimal.
- “Luck” is partly real, small skills. Some of the gap between record and expectation is genuine — a great kicker, an elite quarterback in two-minute drills, a defense that stiffens in the red zone. The residual is mostly luck, not entirely. It regresses hard, but not all the way.
There is also a more sophisticated cousin worth knowing. Second-order wins replace season point totals with a game-by-game postgame win expectancy built from the box score, which catches things Pythagorean's raw points miss. The two methods usually agree on who got lucky; they disagree on the details. Pythagorean's virtue is that you can do it on a napkin with two numbers, and it still lands within a game.
Do it yourself
You need exactly two numbers and a calculator. Take any team's season points for and against, raise each to the 2.37 power, and divide. The site's Pythagorean calculator does it for you and even converts the win percentage into an expected win total over the schedule length you enter — the same math behind every figure in the tables above. Run your own team through it, compare the answer to its actual record, and the size of the gap is your estimate of how much luck — good or bad — the season really held. If the record beat the expectation by two wins, temper your optimism. If it fell short by two, next year is probably brighter than the standings suggest.
Sources & further reading
- See also Chapter 18: Game Outcome Prediction (DataField.dev).
- ESPN public site API — final scores of the 2024 FBS season (134 full-schedule teams) behind the expected-versus-actual tables, computed at exponent 2.37; retrieved June 2026
- Bill James — the original Pythagorean expectation (baseball), in the Bill James Baseball Abstract series
- Football Outsiders — the Pythagorean projection and the ~2.37 football exponent. The site is no longer online and I have no live URL to point you at, so this is a credit, not a link.
- CollegeFootballData — collegefootballdata.com, free scores and advanced stats to reproduce the season table
- Related: Second-order wins · Close-game records and luck · Strength of schedule · Ohio State's 2024, game by game