Through Saturday, October 3, fourteen FBS teams were unbeaten, and the eleven of them ranked in the October 4 AP poll stand in nearly the order the voters gave them in August: 48 of the 55 pairs among them keep their preseason order. Six of the eleven were ranked in the preseason poll and have yet to beat a team that was ranked when they played it: Georgia, Notre Dame, Miami, Indiana, BYU and Utah. Of the fifteen pairs among those six, fourteen are still in their August order. The one that flipped, Miami over Indiana, flipped the week Indiana beat Northwestern by six.
That is not the voters ignoring five weeks of football. It is the poll doing what three seasons of ballots say it does. A ranked team that wins gets past a ranked team that also won for one of two reasons: it beat a ranked opponent, or the team above it barely won. Without either, it rarely happens. In 2024, 2025 and 2026 to date, two ranked teams both won between the same two polls 4,203 times, and the lower one finished ahead 207 times, 4.9%. When the lower team had beaten a ranked opponent and the upper team had not, it finished ahead 18.4% of the time. When neither had, and the upper team won by more than a score, 2.3%.
What was pulled, and how a pass is counted
data_layer/build_ap_polls_2024_2026.py pulls every AP Top 25 from ESPN's core rankings API, with the point total of every team receiving votes: the six 2026 polls from the preseason poll of August 17 through October 4, all sixteen 2025 polls from the preseason through the poll after the conference championship games, and fifteen of 2024's sixteen. ESPN returns nothing for the 2024 preseason poll, so 2024 starts at its first in-season poll. The builder also walks ESPN's public scoreboard one day at a time and keeps the 2,216 final games involving an FBS team in those windows. ESPN labels the first in-season poll “Week 2,” so this piece names polls by date and assigns each game to the gap between two polls by its kickoff time. FBS membership follows the rule every 2026 piece here has used, which treats North Dakota State as an FCS program; counted ESPN's way, North Dakota State would make the unbeaten FBS teams fifteen, since it is 5-0.
That assignment is checked against ESPN's own records. In all 773 cases where a team was ranked in two consecutive polls, its record moved by exactly the wins and losses the scoreboard put in that gap. The polls check out as well. A ballot ranks 25 teams and hands out 25 points down to 1, 325 in all, so a poll's total should be 325 times its number of voters. Every 2026 poll balances exactly, with 68 to 70 voters, and 35 of the 37 polls balance to the point; the October 5, 2025 poll is two points short and the December 8, 2024 poll ten over, and both are kept.
The unit is a pair: two teams ranked in one poll, what each did before the next poll, and where they stood in it. A team that played and won every game in the gap is a winner. Order is by points rather than rank, because ties at a rank are common. The upper team is the one with more points, and the lower team passed it if it has more points in the next poll. A team that falls out of the top 25 keeps the points it got from the others-receiving-votes list, and a team with no votes has zero. A “ranked opponent” is one ranked in the poll before the game.
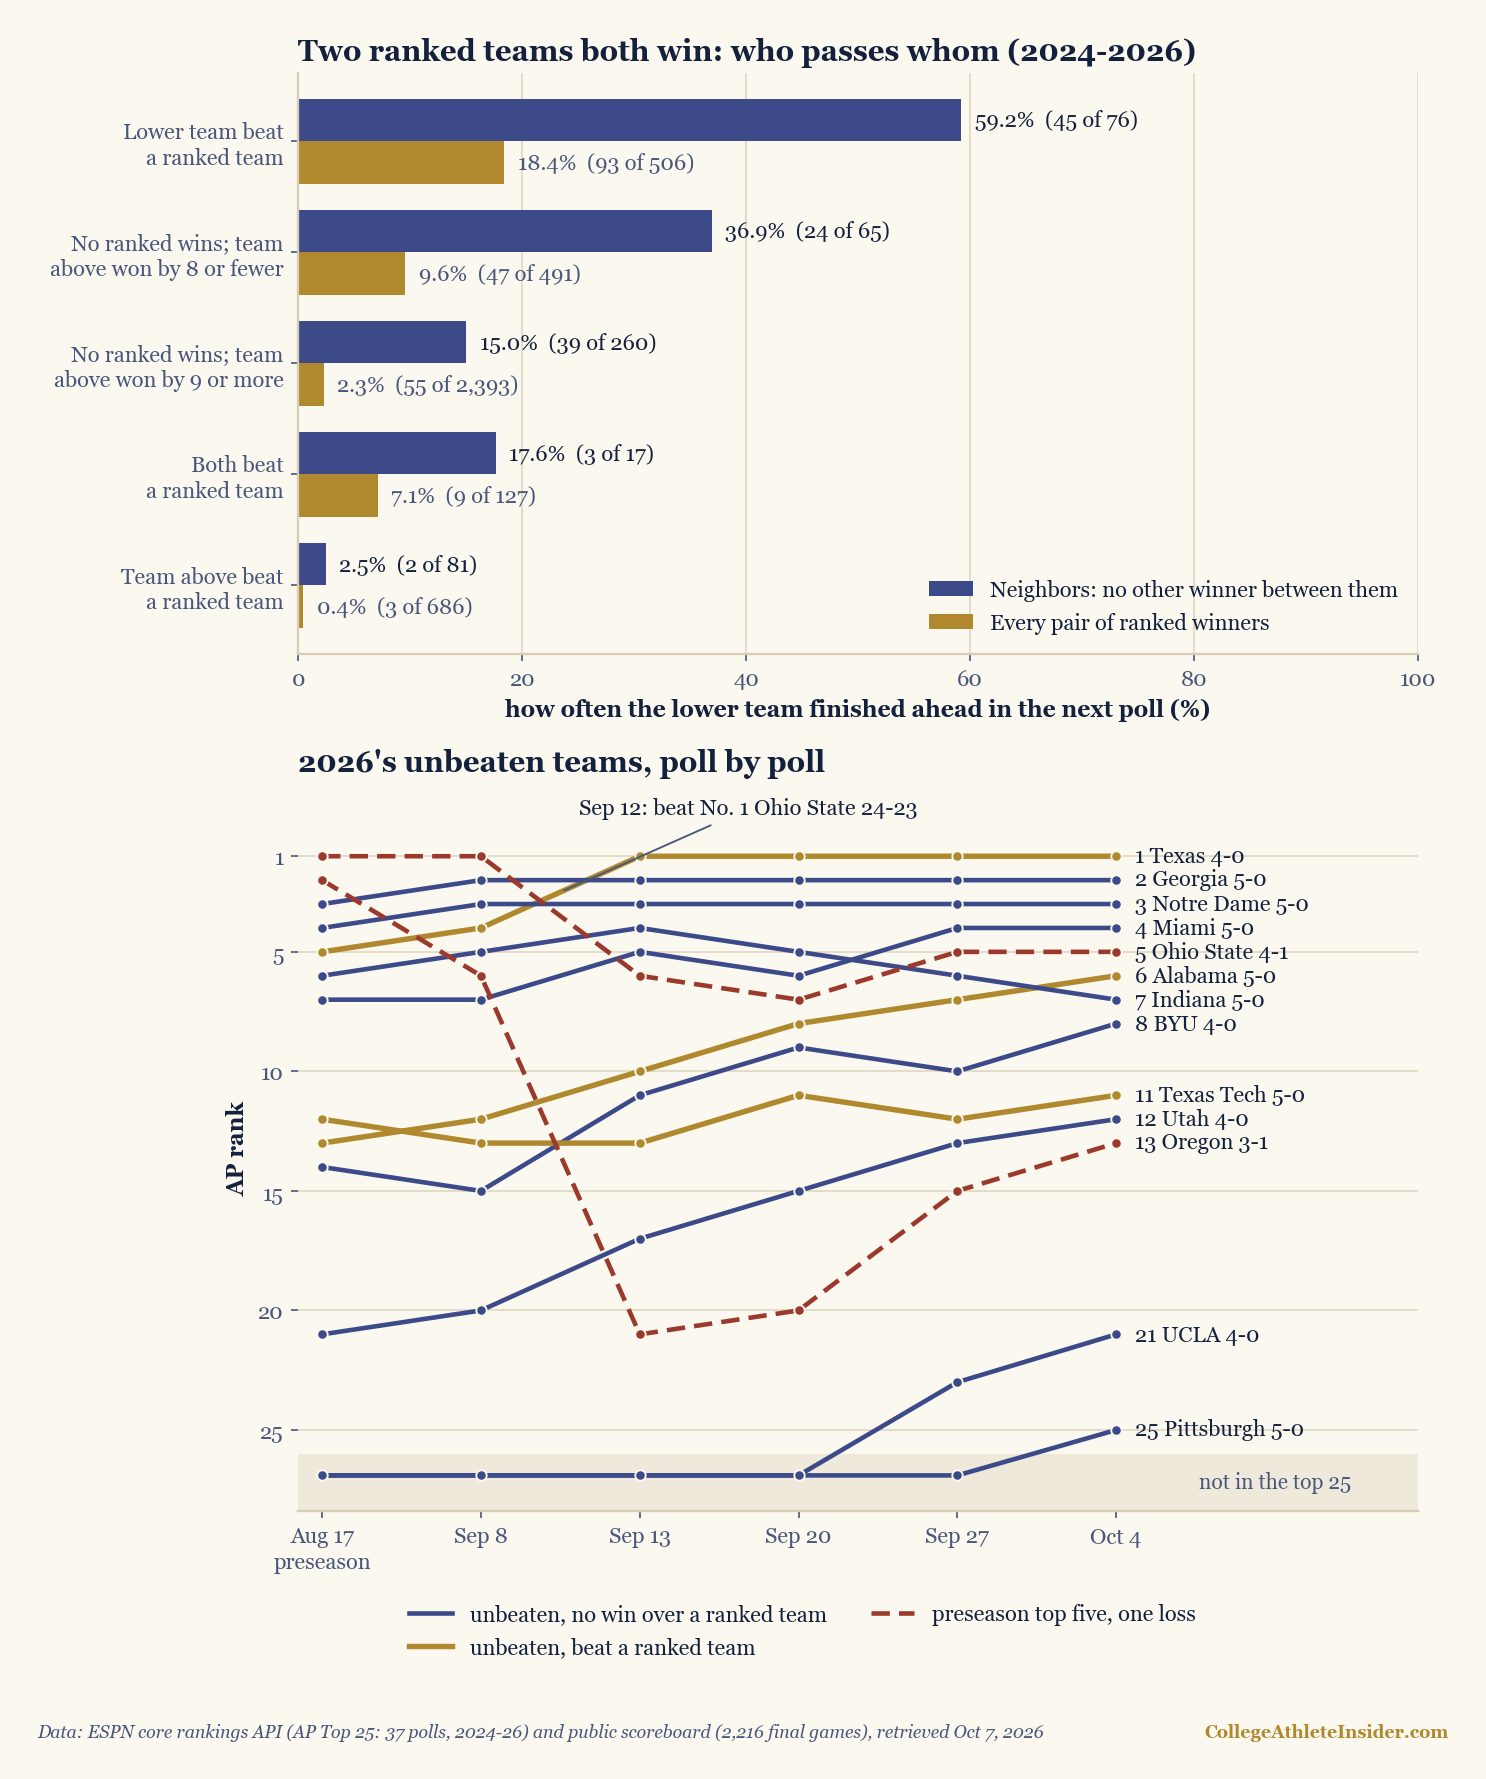
charts/chart_ap_poll_queue.py — 116 checks.The rule, measured
| Both won, and | Every pair | Neighbors |
|---|---|---|
| the lower team beat a ranked team; the upper did not | 93 of 506 (18.4%) | 45 of 76 (59.2%) |
| neither beat a ranked team; the upper won by 8 or fewer | 47 of 491 (9.6%) | 24 of 65 (36.9%) |
| neither beat a ranked team; the upper won by 9 or more | 55 of 2,393 (2.3%) | 39 of 260 (15.0%) |
| both beat a ranked team | 9 of 127 (7.1%) | 3 of 17 (17.6%) |
| the upper team beat a ranked team; the lower did not | 3 of 686 (0.4%) | 2 of 81 (2.5%) |
| all | 207 of 4,203 (4.9%) | 113 of 499 (22.6%) |
Neighbors are two ranked winners with no other ranked winner between them. They are the closest calls a voter faces and the fairest test, since a swap between No. 3 and No. 22 was never on the table. Even there, with nothing on the scoreboard to separate them except margins against unranked opponents, the lower team finished ahead only 15.0% of the time. Give it a win over a ranked team and that becomes 59.2%. Give the team above it the ranked win instead and it falls to 2.5%: in 81 such pairs the lower team got past twice.
The pattern is not one season's. The share of all winner pairs that swapped was 6.2% in 2026, 4.7% in 2025 and 4.4% in 2024; among neighbors it was 22.8%, 22.3% and 22.9%. The coaches' ballot, checked for 2026 only, behaves the same way: 50 swaps in 900 winner pairs, 5.6%, and 8 in 616, 1.3%, when neither team beat a ranked opponent and the team above won comfortably. The AP figure for that last group in 2026 is 2.0%.
Most of the poll's movement comes from losses. A winner finished ahead of a ranked team above it that lost 742 times in 1,165, 63.7%, and ahead of one that did not play 69 times in 801, 8.6%. The reverse almost never happens: a team that lost finished ahead of a ranked team above it that won exactly once in 1,614 pairs. The exception is Michigan's, below.
A worked example: the Saturday Texas took No. 1
The September 8 poll had Ohio State first with 1,684 points and 46 of the 69 first-place votes, Georgia second with 1,532, Notre Dame third with 1,512 and Texas fourth with 1,462. On Saturday, September 12, Texas beat Ohio State 24-23 in Austin, Georgia beat Western Kentucky 70-20 and Notre Dame beat Rice 52-0.
The September 13 poll had Texas first with 1,678 points and 56 of 68 first-place votes, up 1,678 − 1,462 = 216. Georgia and Notre Dame each gained 19, to 1,551 and 1,531. Texas began the week 1,532 − 1,462 = 70 points behind Georgia and finished 1,678 − 1,551 = 127 ahead, a swing of 70 + 127 = 197 points on one game. Both of its passes sit in the first row of the table: the lower team beat a ranked team, the upper team beat an unranked one. Ohio State lost 1,684 − 1,407 = 277 points and fell to sixth, below exactly the five teams now above it, Texas, Georgia, Notre Dame, Indiana and Miami, every one of which had won.
The same Saturday shows how much the circumstances of a loss matter. Oregon, sixth with 1,422 points, lost 39-31 at Oklahoma State, which was not ranked, and fell to No. 21 with 324. A one-point loss to the No. 4 team cost the No. 1 team five places; an eight-point loss to an unranked team cost the No. 6 team fifteen. Oregon had already slipped once. It opened by beating Boise State 34-27, and Georgia, Notre Dame, Texas and Indiana, each of which won by more than a score, went past it: second to sixth after a win. That is the second row of the table.
The win that cost a ranking
Michigan began the season No. 16 with 718 points and opened at home against Western Michigan on September 5. It won 13-12 on a 47-yard touchdown pass on the final play, after one second was put back on a clock that had appeared to run out, as both WILX and Bleacher Report described it. The September 8 poll gave Michigan 69 points and no ranking: a fall of 718 − 69 = 649 points, more than twice what Ohio State lost a week later by losing as the No. 1 team. Nine teams that had been ranked below Michigan finished above it, and so did three that had not been ranked in August at all; Michigan was 28th in points. Western Michigan went from 1 point to 12.
One of the nine was Louisville, No. 24, which had lost 41-38 to Ole Miss. It kept its ranking with 163 points, and it is the single case in three seasons of a team that lost finishing ahead of a ranked team above it that won. The voters scored the near-miss rather than the result. The coaches did not: their poll kept Michigan at No. 24 with 164 points. Michigan's week is the extreme; the second row of the table is the everyday version. Washington, No. 19 on September 8, beat Utah State 16-14 on September 12 and fell out of the poll with 172 points.
What a loss costs
How far a loss drops a team depends mostly on where it was standing. Ranked teams lost 182 times in the gaps between these polls, to ranked and to unranked opponents:
| Rank | Lost to | Losses | Fall | Out |
|---|---|---|---|---|
| 1–5 | ranked | 20 | 4 | 0 |
| 1–5 | unranked | 6 | 6.5 | 0 |
| 6–10 | ranked | 17 | 7 | 0 |
| 6–10 | unranked | 18 | 8 | 2 |
| 11–15 | ranked | 19 | 6 | 0 |
| 11–15 | unranked | 16 | 8 | 7 |
| 16–25 | ranked | 45 | 4 | 27 |
| 16–25 | unranked | 41 | 5.5 | 37 |
None of the 26 losses by a top-five team pushed it out of the poll. The worst fall was thirteen places, 2024 Notre Dame going from No. 5 to No. 18 after losing 16-14 at home to Northern Illinois. A team ranked 16th to 25th that lost was gone the next week 64 times in 86. Part of that is arithmetic, since a No. 20 team has only five places of room. Part of it is a cushion: a top-five team gives up points when it loses, but it starts so far ahead of most of the teams below it that only the nearest winners catch it. Ohio State's one-point loss on September 12 cost it 277 points, and five teams passed it.
The claim this site made in June
In June this site published a model of how fast a season's results should outweigh a preseason poll; it is now a section of the piece on when the record starts to mean something. Under moderate trust in the poll, the model said, results take over after about five games, “roughly early October — yet voters routinely keep top-five preseason teams parked near the top long after that.” The model was labelled as a model, and that sentence was a complaint rather than a measurement. Here is the measurement.
In 2026, four of the five preseason top-five teams are in the top five on October 4: Texas first, Georgia second, Notre Dame third and Ohio State fifth. Ohio State is 4-1 and ranks above seven unbeaten teams. Oregon, the fifth, is No. 13. So far that reads like the June sentence. 2025 does not. Texas, its preseason No. 1, lost its opener 14-7 at Ohio State and dropped only to No. 7. Clemson lost its opener 17-10 at home to LSU and dropped to No. 8. Penn State lost for the first time 30-24 at home to Oregon and dropped to No. 7. Each of the three was out of the poll the week of its second loss: Clemson after losing 24-21 at Georgia Tech, Texas after losing 29-21 at Florida, Penn State after losing 42-37 at UCLA. Neither Penn State nor Clemson was ranked again before the bowls; Texas returned a week later by beating a ranked Oklahoma 23-6. The other two, Ohio State and Georgia, were third and second after the conference championship games, both 12-1.
In the 34 gaps between polls, top-five teams lost for the first time 21 times. All 21 stayed ranked, 17 stayed in the top ten and none fell below No. 18. That is the cushion the June piece saw, and it is real. “Parked” is wrong. The cushion belongs to the current ranking, not the August one: in three seasons only two teams ranked in the top ten fell out of the poll after a loss, and they were 2025's preseason No. 1 and No. 2, Texas and Penn State, both losing for the second time on October 4 and both gone from the next day's poll.
The June piece was right that the poll holds on to August and wrong about how. The anchor is not loyalty to the preseason powers; it is a queue. A winner gets past a winner on a ranked win or on a near-miss by the team above, so the August order lasts as long as the schedule keeps ranked teams apart, and in September it mostly does: in the gaps that ended with a September poll, 203 of the 241 wins by ranked teams, 84.2%, came against unranked opponents. Eight of the eleven ranked unbeatens have yet to beat a ranked team. The two that began outside the poll, UCLA and Pittsburgh, are No. 21 and No. 25, below all nine unbeatens that began inside it and below eleven and fourteen teams with a loss.
Nor does the queue loosen as the weeks pass. In 2024 and 2025 together, neighbors swapped in 30.6% of pairs in September polls (45 of 147), 23.4% in October, 15.2% in November and 10.7% in the two December polls; in the third row of the table alone, 24.4%, 13.6% and 7.6% from September to November. That falling rate is not, by itself, proof of anchoring. A ranking that has absorbed eight games should move less on a ninth than on a second, and the June model's own arithmetic says so, since the weight on each new game is 1/(k + n) and shrinks as n grows. What it does show is that the August order does not wear away on its own. It changes when teams lose and when ranked teams play each other.
Limits
A box score, not a ballot. Voters see injuries, film and replay controversies that a final score does not carry, and Michigan's last-play win is the clearest example in these data. The table describes what the scoreboard predicts about the next poll, not why any voter voted as they did. The eight-point line is a choice. Moving it changes the rates and not the ordering: with the line at three points, the near-miss group passes at 11.6% against 2.8% for the rest, and at 21 points, 6.4% against 1.4%. “Ranked” means ranked in the poll before the game, so a win over a team that was unranked at kickoff and ranked later counts as an unranked win. Points, not ranks: a team outside the top 25 keeps its others-receiving-votes total, a team with no votes counts as zero, and two pairs that finished level on points are not counted as passes. Three seasons, and 2026 supplies only five of the 34 gaps; the 2024 preseason poll is missing from ESPN's feed, and two polls do not balance to the point. Not a verdict on the voters. Most September wins come against opponents that settle very little, which is what the piece on how much week one told us measured, and a poll that declines to re-sort on them is not obviously wrong. Nothing here says whether the August order was right; what a week-one loss actually costs asks the related question in wins rather than votes.
Sources and reproducibility
AP Top 25 polls from ESPN's core rankings API, sports.core.api.espn.com/, where the AFCA Coaches Poll is rankings/2, and final scores from ESPN's public scoreboard, site.api.espn.com/, walked one date at a time. Retrieved October 7, 2026 by data_layer/build_ap_polls_2024_2026.py and saved as data_layer/ap_polls_2024_2026.json; the builder refuses to write if any game before the last poll is unfinished. Every number on this page is recomputed by charts/chart_ap_poll_queue.py, registered in charts/build_charts.py, which runs 116 checks, including the record and ballot-total checks above, and refuses to draw the chart if one fails. The account of Michigan's final play comes from WILX and Bleacher Report, which agree on the score, the restored second and the 47-yard pass; the coaches' No. 24 ranking is in both ESPN's feed and WILX's report.
The unbeaten curve after three weeks counted who was still perfect; this piece is about where the perfect teams stand. The K-factor piece describes the dial a rating turns to decide how far one game should move it. For a comfortable win over an unranked team, the AP poll keeps that dial turned most of the way down, and the August order is what is left.