A team finishes 7–1 in one-score games and the storyline writes itself: they’re clutch, battle-tested, the kind of team that finds a way. I want to spoil that storyline. A great record in close games is mostly luck — it doesn’t carry over the way real skill does — and I’ll go further: a team’s record in one-score games is the most overrated number in college football. Not useless, but close. The team that went 7–1 in nail-biters is, more than anything else, a team that won a pile of coin flips, and coin flips don’t remember that you won them last time.
Before the numbers, the same disclosure the recent pieces here have all made: what follows is a clearly-labelled model, not a database of game results. I built a small simulation, ran it, and I’m reporting what it produced. The point is the mechanism — why close-game records behave the way they do — not a claim about any particular team’s season.
The model in one paragraph
Give every simulated team a true strength. Have each one play two independent halves of a season against random opponents. Split each game into two kinds. A comfortable game — decided by more than a touchdown — goes to the stronger team cleanly; strength wins, the way it’s supposed to. A close game — decided by a touchdown or less — is modeled as nearly a coin flip regardless of who’s better, because that’s what a one-score finish largely is: a few plays at the margin that could fall either way. Then I take each team’s record in the first half of the season and correlate it with its record in the second half, separately for each bucket. If a kind of winning is real skill, the two halves should agree. If it’s luck, they won’t.
The exhibit
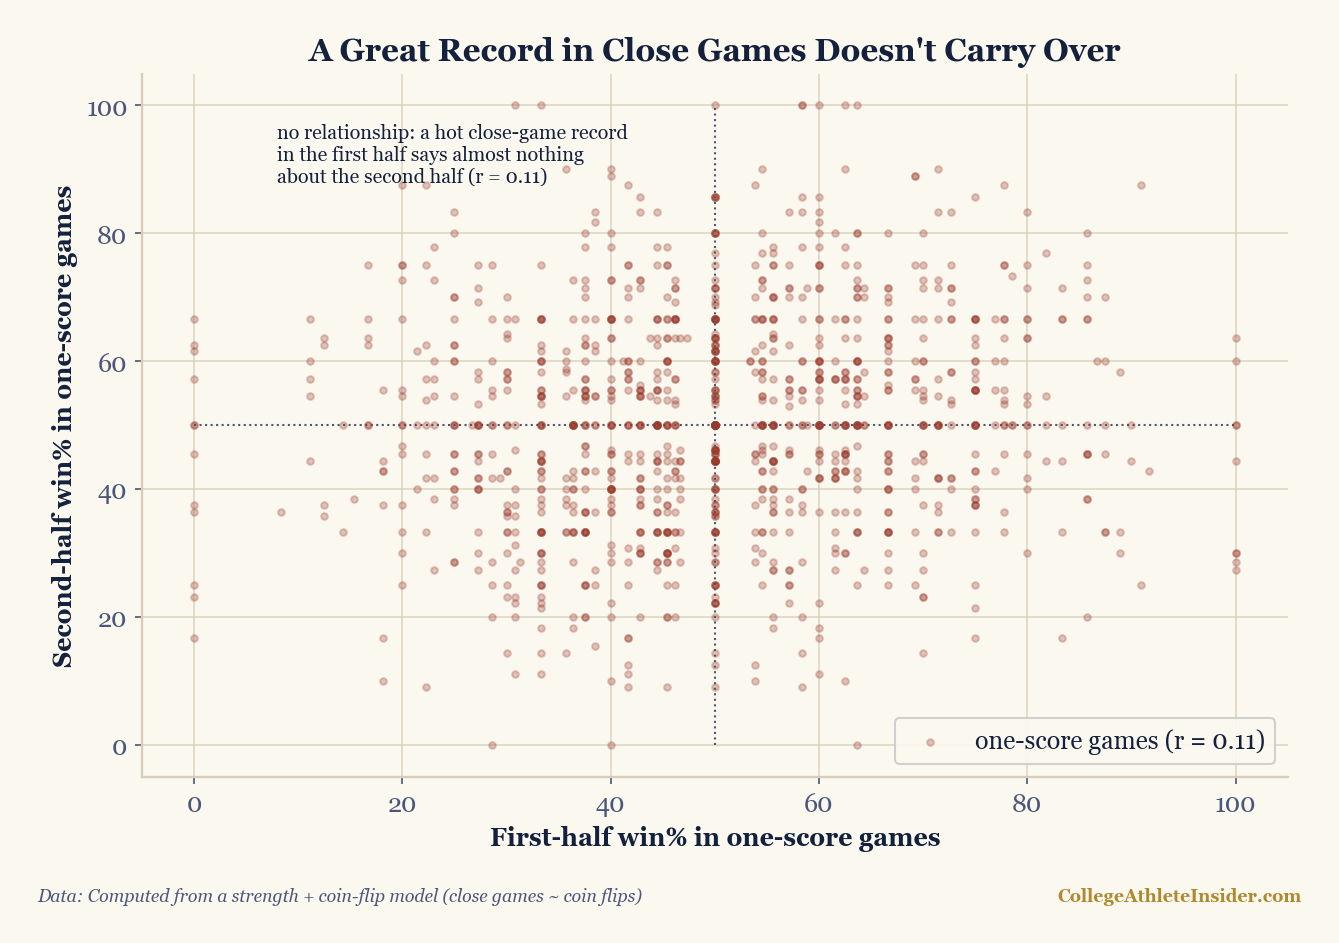
Here is the whole argument in two numbers. In one-score games, the half-to-half correlation comes out to r = 0.11 — essentially no relationship. A great close-game record in the first half of the season tells you almost nothing about the second. In comfortable games, the same correlation is r = 0.62 — a strong relationship; that record persists, because it’s tracking real strength. Close-game record is roughly six times less persistent than comfortable-game record. The “clutch” team is mostly the team that won some coin flips, and the model is blunt about what that’s worth going forward: nearly nothing.
What r = 0.11 versus r = 0.62 actually means
A correlation is just a number for how tightly two things move together, from 0 (no relationship) to 1 (a perfect one). Picture the scatter plot. A correlation near zero is a shapeless round cloud — knowing where a team sits on the horizontal axis (its first-half close-game record) lets you guess essentially nothing about where it lands on the vertical (its second-half record). That’s the one-score panel at r = 0.11: a blob with no tilt to it. If close-game records were skill, that cloud would stretch into a line running up to the right, the way the comfortable-game cloud does at r = 0.62 — teams that win comfortably in the first half tend to win comfortably in the second, so the points line up. The two pictures sit side by side in the model, and they could not look more different. One is a relationship. The other is static.
So walk through how a team goes 6–1 in one-score games and then 2–5 the next year with no change in quality whatsoever. In year one, seven of its games came down to the final possession, and it happened to win six of them — a good run of bounces, a couple of last-second kicks that drifted inside the upright, an opponent’s fumble at the worst possible time. None of that is repeatable; it’s the coin landing heads six times out of seven. The next year the same team plays the same way, again lands in seven one-score games, and this time the coin comes up its way twice. Nothing about the roster, the coaching, or the scheme changed. The luck changed, and luck has no memory. A 6–1 close-game record was never describing the team; it was describing the coin. That swing — a four-game collapse in the standings from pure variance — is exactly what an r of 0.11 predicts will happen all the time.
Where this is too tidy
I won’t oversell my own simulation. The honest caveats:
- It’s a model. The exact figure — 0.11 — is an output of my assumptions, not a measured constant of the universe. Take the direction and the magnitude (close-game records barely persist; comfortable-game records strongly do), not the third decimal place.
- “Nearly a coin flip” is the crux, and it’s an idealization. In reality a small amount of close-game skill is real. A great kicker, an elite quarterback who is genuinely better in two-minute drills, a defense that gets one more stop when the field shrinks — football’s version of a lights-out bullpen — nudges close games slightly away from 50/50. So the true correlation isn’t exactly zero. It’s just low. The model overstates the coin-flip-ness a touch; it does not invent the effect.
- Schedule is random here. The simulation draws opponents at random and ignores the fact that real schedules are lumpy — that some teams play more genuine toss-ups than others. That would move the numbers around without touching the conclusion.
Where the idea comes from
This isn’t a hunch; it sits squarely in the luck-versus-skill tradition that runs through football and baseball analytics. The well-worn finding is that one-score records regress hard — a team’s win total in close games is among the least repeatable things about it, which is why Pythagorean expectation (estimating wins from points scored and allowed) so often flags the teams whose records outran their underlying play. Those are usually the teams that cleaned up in one-score games, and they’re the ones the projection systems quietly fade. It’s the same machinery behind second-order wins, which strip the close-game luck out of a record to ask how many games a team should have won, and it rhymes exactly with what I’ve argued about turnover margin: a stat that explains last Saturday beautifully can still be near-worthless for predicting next season, because the part that swings games is the part that doesn’t repeat. If you want the in-game cousin of all this, when a lead is actually safe is the same coin viewed mid-flight. And it’s why I keep insisting that results should outweigh the preseason poll on a schedule — but only the right results, the comfortable wins that track strength, not the white-knuckle ones that track variance.
Reproduce it
There’s nothing to hand-enter. The simulation — assign strengths, play two half-seasons, bucket each game as close or comfortable, then correlate first-half and second-half records within each bucket — and the two correlations it produces (r = 0.11 for one-score games, r = 0.62 for comfortable ones) are generated by charts/chart_one_score_luck.py. Turn the close-game outcome from a coin flip toward strength-decided and you’ll watch the 0.11 climb; that dial is the assumption the whole piece rests on. If you’d rather feel the same regression in something hands-on, the rating and win-probability tools on the calculators page run on the identical logic of separating signal from noise.
The takeaway
Be impressed by a team that wins comfortably; that record is telling you something durable. Be skeptical of a team whose case rests on going 7–1 in one-score games, because the model says that record is six times less likely to survive the move to next season. Clutch makes a great story. It makes a lousy prior. Win the close ones if you can — just don’t bank on having won them.
Sources & further reading
- Background: Chapter 8: Probability: The Foundation of Inference (DataField.dev).
- The model and both correlations (
r = 0.11for one-score games,r = 0.62for comfortable games) are computed bycharts/chart_one_score_luck.py— a labelled strength-plus-coin-flip simulation, not game data. - Background: that close-game and one-run records regress hard toward the mean is a standard luck-versus-skill result in football and baseball analytics — the same intuition behind Pythagorean expectation (expected wins from points scored and allowed); any introductory sabermetrics or football-analytics reference (or the chapter above) covers it.
- Related: second-order wins, turnover margin and luck, and when a lead is safe — the same coin from three other angles.