Here is the most important sentence in college sports analytics: not all 11-1 records are created equal. Two teams can post the same gaudy mark, the same shiny scoring margin, the same highlight reel — and be separated by a canyon, because one of them played a murderer's row and the other feasted on the soft underbelly of the schedule. Strength of schedule (SoS) is how we measure that canyon. Let's build a real one.
The simplest honest SoS
There are fancy versions, but the cleanest place to start is also the most intuitive: the average winning percentage of the teams you played.
SoS(team) = mean( opponents' win% )
That's it. If your opponents collectively went .600, your schedule was tougher than a team whose opponents went .450. From here you can get more sophisticated — weighting by location, by margin, by opponents' opponents — but the core idea never changes: judge a team by the company it kept.
A worked example: Oregon, 2024
Oregon went undefeated in the 2024 regular season and earned the No. 1 seed. Was the schedule worthy? Here are selected opponents and their final records (the full slate and the script are in /scripts):
| Opponent | Record | Win% |
|---|---|---|
| Boise State | 12-1 | 92.3% |
| Penn State | 11-2 | 84.6% |
| Ohio State | 10-2 | 83.3% |
| Illinois | 9-3 | 75.0% |
| Michigan | 7-5 | 58.3% |
| Washington | 6-6 | 50.0% |
| Oregon State | 5-7 | 41.7% |
| Purdue | 1-11 | 8.3% |
Average those win percentages across the whole schedule and Oregon's SoS lands around 54% — a genuinely strong slate, top-heavy with playoff-caliber opponents (Boise, Penn State, Ohio State) and only one true gimme (Purdue). The undefeated record was earned.
The other side: padded résumés
Now the uncomfortable part. Run the same calculation for every team and a familiar name shows up among the easiest schedules in major college football:
That's not a knock on Indiana's season; winning eleven games is hard against anyone. It's a demonstration of why analysts adjust. When we ran a one-pass schedule adjustment in our spreadsheet tutorial, Indiana fell from third in raw margin to roughly eleventh — exactly because of that 39.6%. The wins were real; the dominance was partly a function of who was on the other sideline.
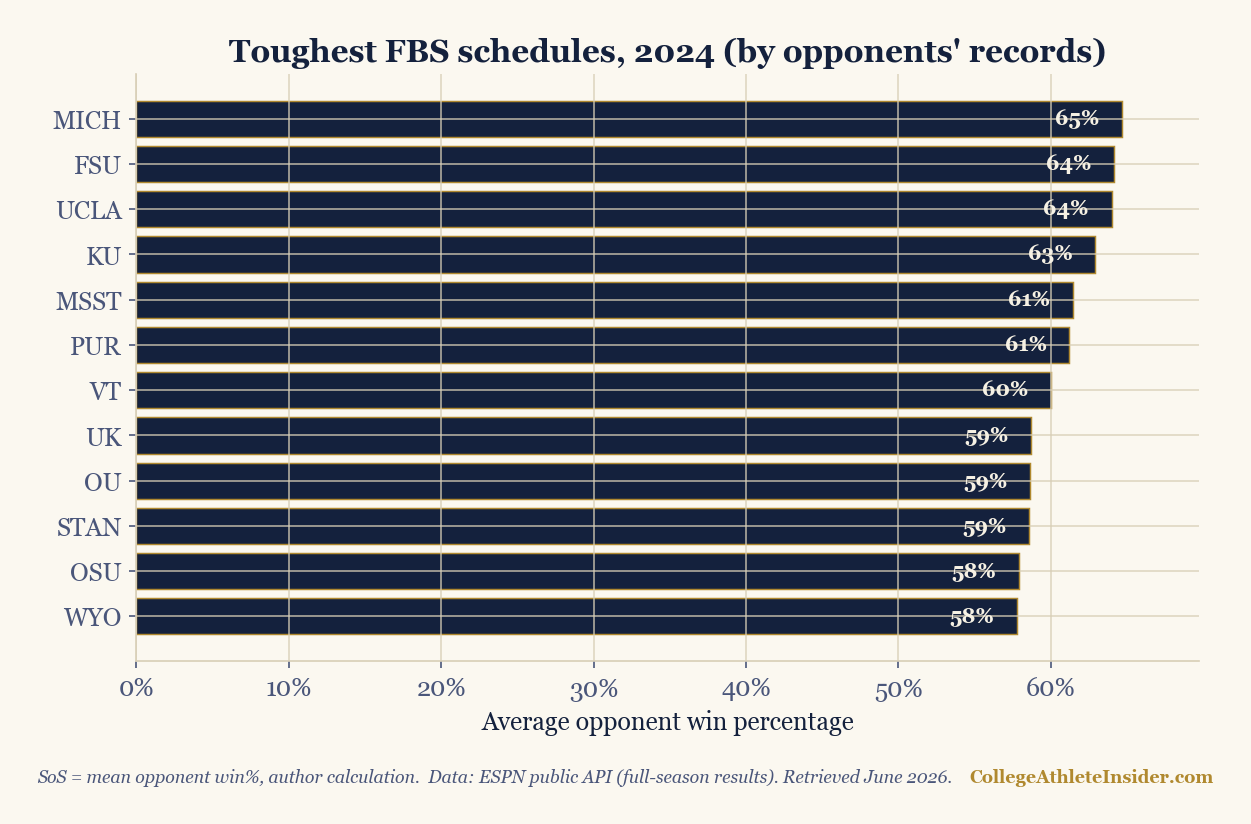
Look closely at that chart and you'll spot the trap in reverse: some of the toughest-schedule teams had losing records. Florida State played a top-five schedule and went 2-10. A hard slate doesn't make a team good — it makes a team's record look worse than its quality. That's the whole reason you can't read standings literally.
Why "opponents' opponents" matters
Average opponent win% has a flaw: it treats a 10-2 opponent the same whether that opponent earned its record against giants or against cupcakes. The next refinement folds in opponents' opponents' records — and once you start chaining that logic, you've reinvented an iterative ratings system, where every team's rating depends on everyone else's, solved by repeating the calculation until it stabilizes. SP+, the NET, and the public basketball ratings are all, at heart, that idea done carefully.
How to use SoS without abusing it
- Pair record with schedule. "11-1" means nothing until you know against whom.
- Beware early-season SoS. Opponents' records aren't settled in September, so SoS swings wildly early. It's a late-season tool.
- Don't double-count. If you're already using an adjusted rating like SP+, schedule is baked in — quoting SoS on top is redundant.
- Context, not excuse. A hard schedule explains a record; it doesn't erase losses.
Strength of schedule is the difference between counting wins and weighing them. Once you weigh them, the sport gets a lot more interesting — and a lot of "obvious" takes fall apart.
Sources & further reading
- Background reading: Chapter 18: Game Outcome Prediction, a free textbook chapter at DataField.dev.
- ESPN public API (full-season results) — used for every figure above
- CollegeFootballData.com — collegefootballdata.com (advanced SoS measures)
- Related: Build an adjusted ranking in a spreadsheet · SP+ explained