Three games into the season, a freshman running back is averaging 7.2 yards a carry and the message-board hype machine is at full tilt. Should you believe it? The honest answer is almost always "not yet," and you can say exactly how-not-yet with one formula. A rushing average is a sample mean, and sample means come with an error bar that shrinks slowly — on the square root of the carries, not the carries themselves. Once you see that curve, "small sample size" stops being a vague caution and becomes a number.
Why an average has an error bar
Every carry is a draw from a wide distribution: most gain a couple of yards, plenty lose ground, and a few break for 40. The spread of those single-carry outcomes is large — call the per-carry standard deviation sd, around 6 yards for a typical back (a model figure, but a realistic one). When you average n carries, the uncertainty in that average is the standard error:
SE = sd / √n, and a 95% confidence half-width ≈ 1.96 × sd / √n
The √n is the whole story. To halve your uncertainty you don't need twice the carries — you need four times as many. That's why early-season averages are so slippery and why they firm up so reluctantly.
The curve: how fast does a rushing average settle?
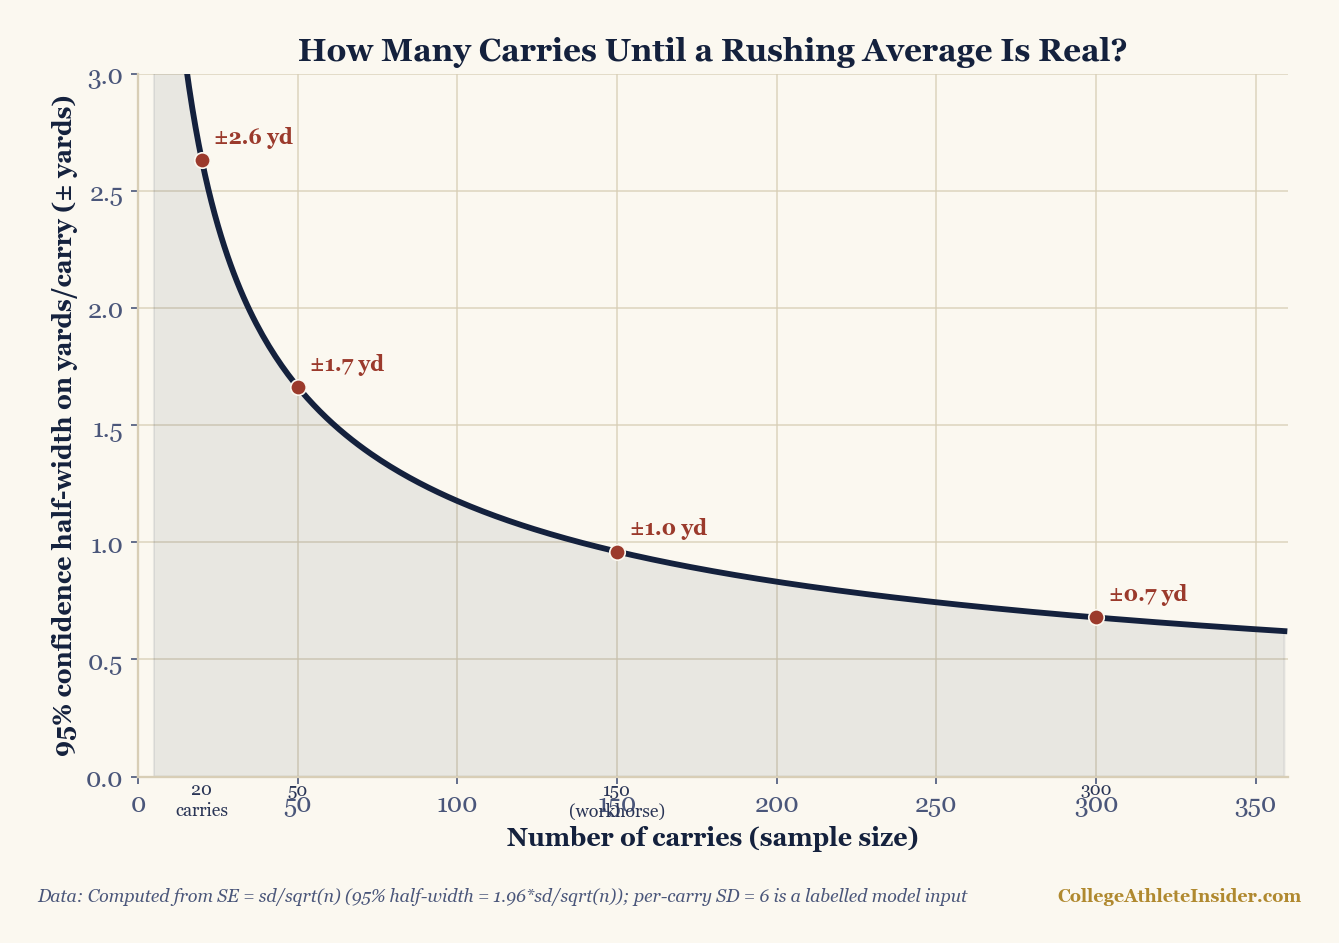
Read the marked points and the intuition snaps into focus:
- 20 carries (a couple of games): the 95% band is about ±2.6 yards. A back "averaging 7.2" could easily be a true 4.6 back on a hot streak — or a true 9.8 monster. You genuinely cannot tell.
- 50 carries: ±1.7 yards. Better, but a full yard and a half of slop in either direction.
- 150 carries (a real workhorse season): ±1.0 yard. Only now is the average pinned tightly enough to separate a good back (5.5) from an average one (4.2) with confidence.
- 300 carries: ±0.7 yard. Bell-cow territory, and even here the average isn't exact.
A worked example: two backs, one mirage
Back A has 18 carries for 7.0 a pop; Back B has 210 carries for 5.2. Whose average do you trust? Compute the half-widths: Back A is 7.0 ± 2.8 (a 95% range of roughly 4.2 to 9.8), Back B is 5.2 ± 0.8 (about 4.4 to 6.0). Back A's flashy 7.0 and Back B's modest 5.2 have overlapping confidence ranges — the data cannot say Back A is actually better, even though his average is 1.8 yards higher. The number with 210 carries behind it is worth far more than the number with 18, and the math says precisely how much more.
Where this simple model bends
- The 6-yard SD is a stand-in. A grind-it-out interior back has a smaller per-carry spread than a boom-or-bust home-run hitter, so the real error bar is narrower for the former and wider for the latter. Plug in the back's own carry-to-carry SD for an exact band.
- Carries aren't independent draws. Game script, opponent, and a dominant offensive line correlate a back's carries, which generally makes the true uncertainty a touch larger than the textbook
sd/√nassumes. The curve is a floor on the error, not a ceiling. - It measures precision, not park-adjusted talent. A tight average against soft schedules still isn't the same as a tight average against ranked defenses. Sample size answers "how stable is this number," not "how good is this player against good teams."
- Yards per carry is itself a leaky stat. It's dominated by a few long runs and ignores down-and-distance. A stable YPC is more trustworthy than a noisy one, but success rate and EPA describe a runner more completely either way.
The takeaway
The next time a small-sample average sets the timeline on fire, do the quick mental math: an error bar that scales with 1/√n means a 20-carry sample is wide enough to hide almost anything, and you need a full workhorse season before a rushing average is trustworthy to within a yard. This is the same logic behind every "regression is coming" take and the reason analysts wait. A hot start isn't a lie — it's just a number that hasn't earned a small error bar yet. (For the related idea of pulling a noisy rate toward the mean, see how rates regress.)
Sources & further reading
- Chapter 12: Confidence Intervals: Estimating with Uncertainty — DataField.dev.
- The standard error of a mean (
SE = sd/√n) is a foundational result; the curve here is computed directly from it, with the per-carry SD entered as a labelled model input, not measured game data. - Related: Success rate and EPA — stats that describe a runner beyond the noisy average, and how rates regress to the mean.
- Related: Explosiveness and yards per play — why a few long runs dominate an average.
- Related: Strength of schedule — the context a stable average still doesn't capture.