Minnesota is 4-2 and Penn State is 3-3. In 2024 and 2025, 12 of the 15 FBS teams that stood 4-2 at this point of the season finished the regular season with at least six wins, and 9 of the 15 that stood 3-3. The forecast in this piece puts the two teams the other way round: Penn State has a 90% chance of reaching six and Minnesota a 60% chance. Minnesota's margins rank it 69th of 136 FBS teams, almost exactly the middle, and the six teams it has left make up the hardest remaining schedule of any team still short of six. Penn State's margins rank it 31st, and the teams it has left average −1.0 on the same scale, where Minnesota's average +8.3.
That reversal is the argument of this piece. In mid-October a record is a weaker guide to six wins than it looks, and so is either obvious correction on its own. Across the 270 FBS team-seasons of 2024 and 2025, a forecast that set each team's margins against its actual remaining opponents cut the error of the record table by 19%. Over the two seasons together, the margins with the schedule ignored, or the schedule with every team assumed average, did no better than flipping a coin for every game that was left.
What was pulled, and what counts as six
data_layer/build_six_win_line_2024_2026.py assembles three seasons from ESPN's public scoreboard. The 2024 and 2025 regular seasons, and 2026 through Saturday, October 3, come from the file built on October 7 for the piece on what moves the AP poll, whose game results matched ESPN's own records in all 773 checks that piece ran. On October 14 the builder walked the scoreboard one date at a time from October 4 to December 14, 2026, adding the results through Monday, October 12 and every game still on the schedule, plus the two Army-Navy dates the earlier file stopped short of. Conference championship games are dropped, and bowls fall outside every window. FBS follows the rule every 2026 piece here has used: 134 teams in 2024 and 136 in 2025 and 2026, with North Dakota State and Sacramento State treated as FCS programs although ESPN now lists them in the Mountain West and the MAC.
The cutoff is the same point in each season, the Monday after the sixth Saturday following Labor Day weekend: October 7, 2024, October 6, 2025 and October 12, 2026. By then most 2024 and 2025 teams had played five games; in 2026, 81 of the 136 have played six. A team reaches six if it finished the regular season with six or more wins against anyone. That is a count of wins, not a ruling on bowl eligibility: the NCAA's bowl rules add conditions, among them limits on counting wins over FCS teams, and we did not re-check those rules for 2026. In the two test seasons no team that reached six needed more than one FCS win to get there. Each season, 82 teams did: 82 of 134 in 2024 and 82 of 136 in 2025.
Five forecasts, scored
Every forecast starts from the same place, a team's wins at the cutoff and the games it has left, and differs in how it prices those games.
- Coin: every remaining game is 50-50.
- Record table: the share of teams with the same record at the cutoff that reached six in the other season. 2024 is scored with 2025's table and 2025 with 2024's, so no season grades itself; a record the other season never saw falls back to the coin.
- Margins only: each team's rating from its games so far, with every remaining opponent assumed average.
- Schedule only: every team assumed average, against the real ratings of the opponents it has left.
- Margins and schedule: the team's rating against each remaining opponent's rating, game by game.
The ratings come from every final margin to the cutoff, by least squares, with three points for the home team, the home edge measured in our home-field piece, and none at neutral sites. FCS opponents share one pooled rating, except the few non-FBS teams with four or more games in a season's file, which get their own; in 2026 those are North Dakota State and Sacramento State, which play full conference schedules against FBS teams. Each rating is pulled toward zero by four phantom games, each a 0-point result against a zero-rated team, the same four-game prior the record piece applied to win percentage. One game's win chance is Φ(edge / 16), the sigma-16 curve from the spread-to-probability piece, and a team's six-win chance adds up every way its remaining games can produce the wins it still needs. Nothing is fitted to the outcome being forecast.
The score is the Brier score: the average squared gap between the forecast and the result, counted as 1 if the team reached six and 0 if not. A forecast of 50% for everyone scores 0.25, and lower is better.
| Forecast | 2024 | 2025 | Both seasons | Right side of 50% |
|---|---|---|---|---|
| Coin | 0.1374 | 0.1486 | 0.1430 | 210 |
| Record table | 0.1430 | 0.1473 | 0.1452 | 216 |
| Margins only | 0.1364 | 0.1616 | 0.1491 | 214 |
| Schedule only | 0.1374 | 0.1489 | 0.1432 | 210 |
| Margins and schedule | 0.1083 | 0.1273 | 0.1179 | 223 |
The combined forecast was the best of the five in both seasons, ahead of the record table by 0.035 in 2024 and 0.020 in 2025. Pooled, it cut the table's error by 19% and the coin's by 18%. Team by team, its squared error averaged 0.0273 less than the table's, with a standard error of 0.0071, so the gap is 3.8 standard errors wide. On their own the two halves are unreliable. The margins alone were the best of the four simpler forecasts in 2024 and the worst in 2025, and the schedule alone scored almost exactly what the coin did in both seasons.
The reason is that six wins is a question asked game by game: how good is this team against this opponent, at this site. A good team with a hard run-in and a poor team with a soft one can carry the same chance. The record cannot tell them apart, and neither can a rating that ignores who is left or a schedule that ignores who is playing it.
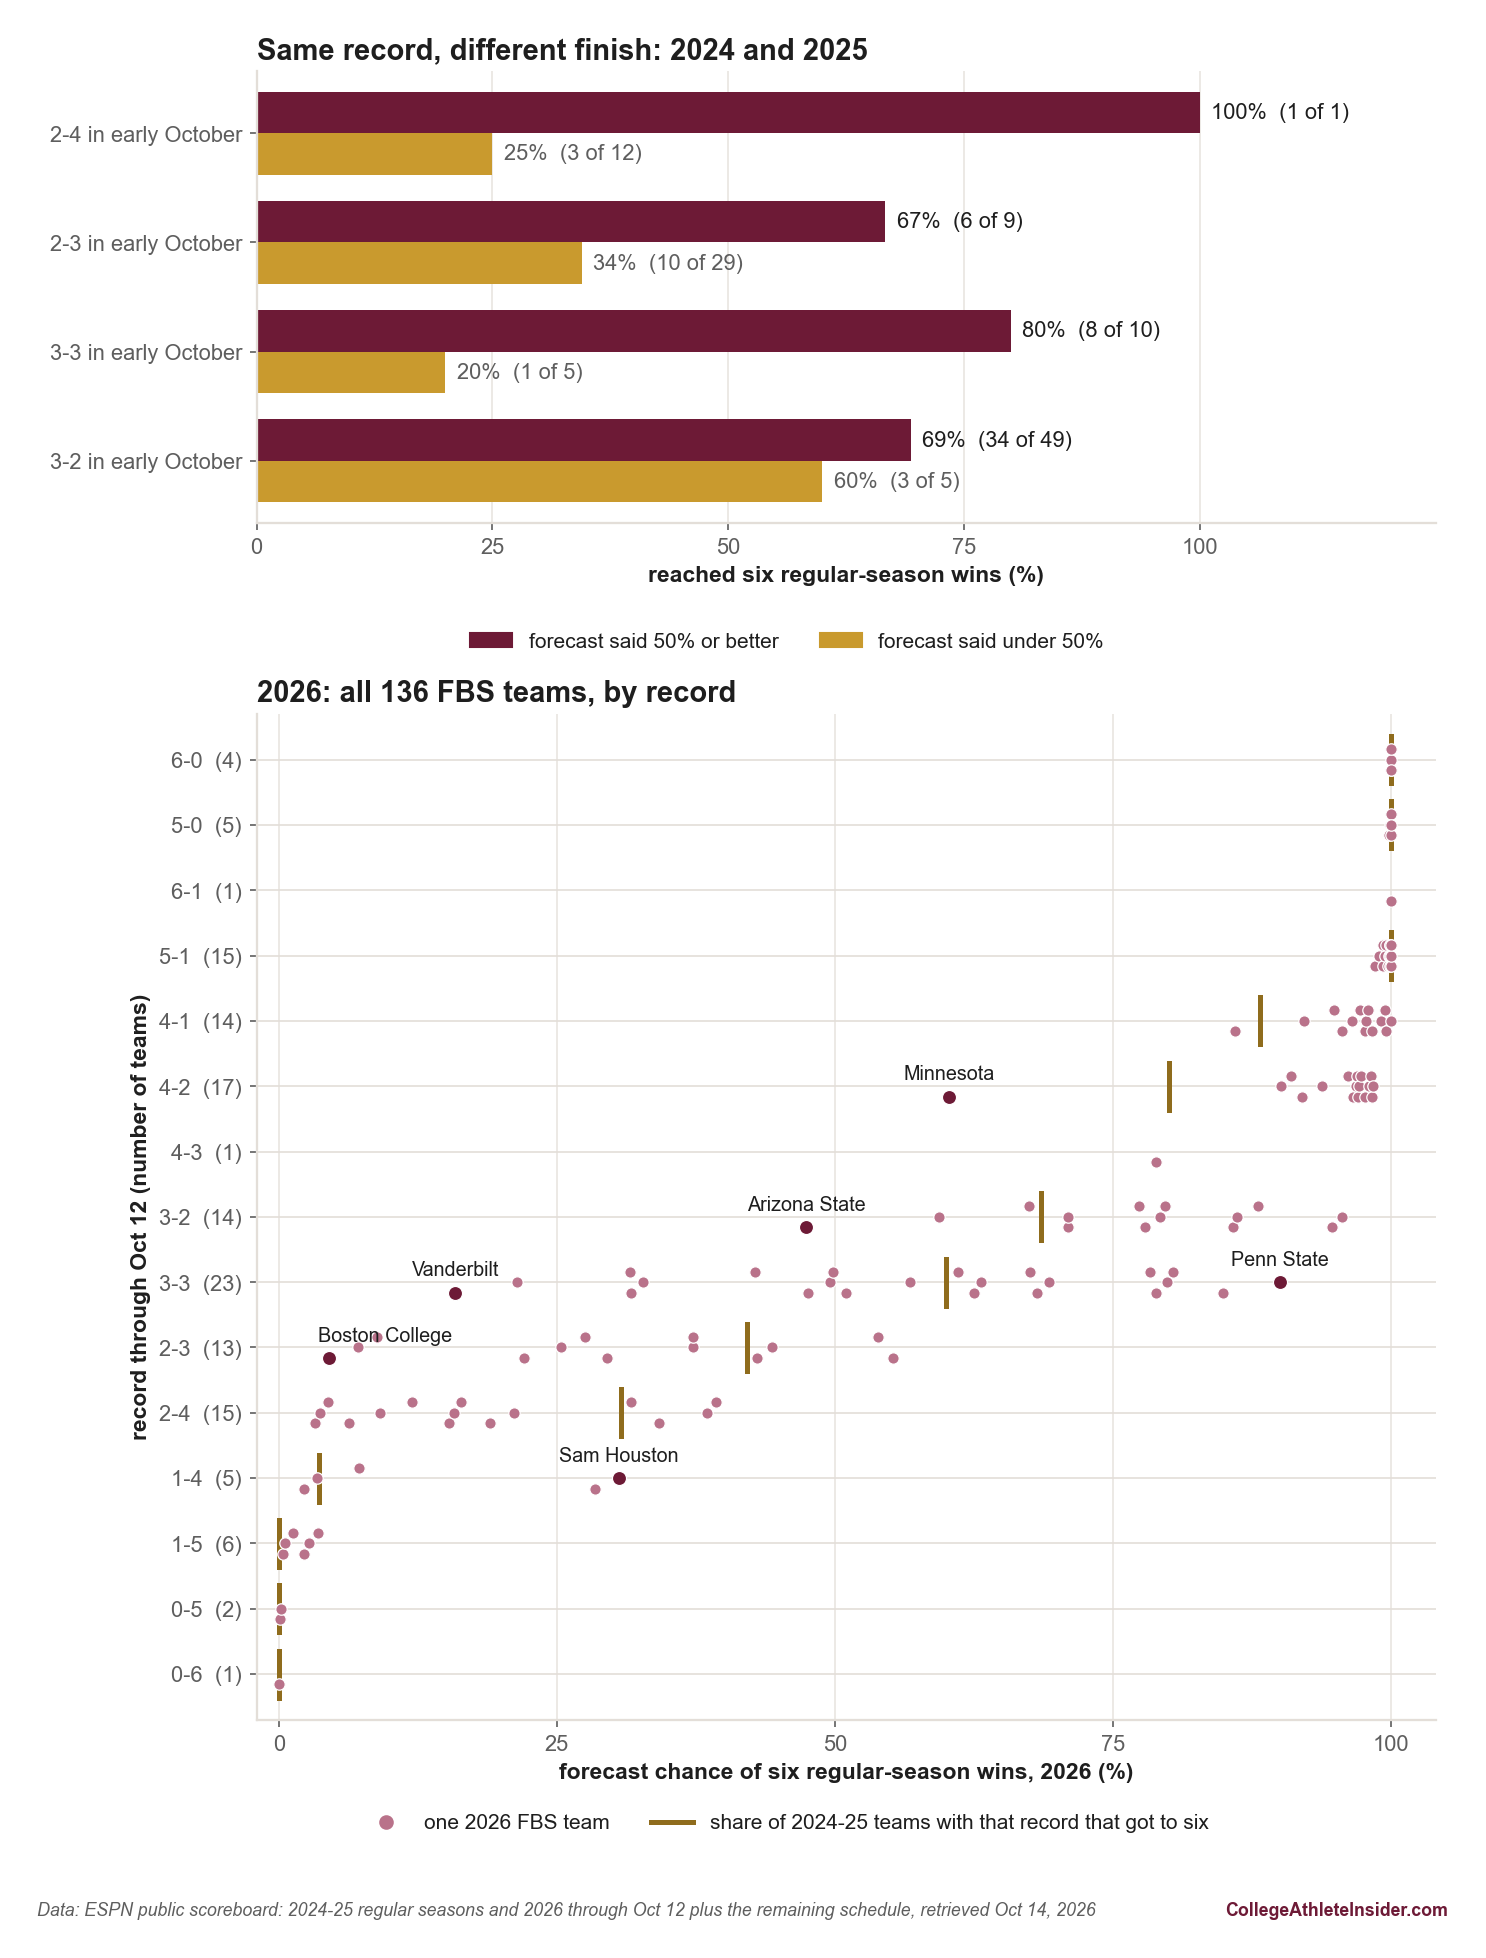
charts/chart_six_win_line_2026.py — 154 checks.Same record, different finish
The top panel splits the middle records by what the combined forecast said. Of the 66 teams that stood 2-3, 3-3 or 2-4 in those two Octobers, the 20 it gave an even chance or better reached six 15 times, and the 46 it gave less reached six 14 times. At 2-3 it was 6 of 9 against 10 of 29. The exception is 3-2, where the five teams it doubted went 3 for 5 against 34 of 49 for the rest; five teams is a small group, and the result is reported as it came out.
| Record | Teams | Forecast 50% or better | Forecast under 50% | All with that record |
|---|---|---|---|---|
| 2-4 | 13 | 1 of 1 (100%) | 3 of 12 (25%) | 4 of 13 (31%) |
| 2-3 | 38 | 6 of 9 (67%) | 10 of 29 (34%) | 16 of 38 (42%) |
| 3-3 | 15 | 8 of 10 (80%) | 1 of 5 (20%) | 9 of 15 (60%) |
| 3-2 | 54 | 34 of 49 (69%) | 3 of 5 (60%) | 37 of 54 (69%) |
When it was confident it was seldom wrong. It put 122 of the 270 teams above 95% or below 5%, three of which already had six wins, and three of those calls missed, all on the high side: Eastern Michigan in 2024 (4-1 at the cutoff, 99.1%), Florida State in 2025 (3-2, 98.8%) and Kansas in 2025 (4-2, 96.6%) each finished with five. No team it put under 5% reached six. It does lean high, though. Added up, its chances came to 86.2 six-win teams in 2024 and 86.6 in 2025, against 82 in each, so its total ran 4.2 and 4.6 teams over.
A worked example: Minnesota's last six
Minnesota's rating is −0.08 and Iowa's is 6.39. At home Minnesota gets the three points, so its edge is −0.08 − 6.39 + 3.00 = −3.47. Divided by 16 that is −0.2169, and Φ(−0.2169) = 0.414. The other five games are priced the same way.
| Date | Opponent | Site | Opponent rating | Minnesota's edge | Win chance |
|---|---|---|---|---|---|
| Oct 24 | Iowa | Home | +6.4 | −3.5 | 0.414 |
| Oct 31 | Indiana | Away | +13.5 | −16.6 | 0.150 |
| Nov 7 | UCLA | Home | +12.1 | −9.1 | 0.284 |
| Nov 14 | Penn State | Away | +5.9 | −9.0 | 0.287 |
| Nov 21 | Northwestern | Home | +5.9 | −3.0 | 0.426 |
| Nov 27 | Wisconsin | Away | +5.8 | −8.9 | 0.289 |
The six chances add up to 1.850 expected wins, and Minnesota needs two. The chance of at least two is one minus the chance of none minus the chance of exactly one. None is the product of the six losing chances: 0.586 × 0.850 × 0.716 × 0.713 × 0.574 × 0.711 = 0.1038. Exactly one has a shortcut: it equals the chance of none times the sum of each game's odds, p / (1 − p). Those odds are 0.706, 0.176, 0.397, 0.403, 0.742 and 0.406, which sum to 2.830, so exactly one is 0.1038 × 2.830 = 0.2938, and at least two is 1 − 0.1038 − 0.2938 = 0.6024. Carried at full precision the figure is 0.6025.
The record table says 80% for a 4-2 team, and a coin for every game says 57/64, or 89.1%. The difference is the schedule. Minnesota's remaining opponents average +8.3, the hardest slate left for any team still short of six; USC's is harder, at +9.1, and USC already has six. Penn State's six games run the other way: 0.509 at Michigan, then 0.702, 0.628, 0.713 at home to Minnesota on November 14, 0.804 and 0.613, for 3.97 expected wins against the three it needs.
Where 2026 stands
Five teams already have six wins: Georgia, Indiana, James Madison, Notre Dame and USC. The forecast puts 49 teams, those five included, above 95% and 15 below 5%, which leaves 72 genuinely open. Twenty-three teams are 3-3, the most common record, and their chances run from 16% for Vanderbilt to 90% for Penn State, where the record table says 60% for every one of them. Some of the other large gaps from the table: Michigan, 3-2, is at 59% against the table's 69%, with remaining opponents averaging +7.4; Arizona State, also 3-2, is at 47%; Washington, 3-3, at 21%; Tulane, 2-3, at 55% against the table's 42%; Sam Houston, 1-4, at 31%, where 1 of the 28 teams with that record in the last two seasons got to six; and Boston College, 2-3, at 4.5%.
Added up, the forecast expects 86.6 FBS teams to reach six. Take off the 4.4 teams a season it ran high in 2024 and 2025 and the estimate is about 82, the number each of those seasons produced.
Limits
Two seasons. The test covers 270 team-seasons, and the 19% is one estimate with the standard error given above, not a constant. Margins only. The ratings know final scores and nothing else: no injuries, quarterback changes or garbage time. Borrowed settings. The home edge, the sigma and the shrinkage come from earlier pieces rather than from these seasons. We tried 36 combinations, from one to eight phantom games, a sigma of 14 to 18 and a home edge of 0 to 5 points, and the pooled score stayed between 0.116 and 0.123, better than the record table's 0.145 every time. Schedule gaps. ESPN lists four Pac-12 games on November 28 with the visitor still “TBD,” at Colorado State, Fresno State, Utah State and Washington State, and Boise State, Oregon State, San Diego State and Texas State have no game listed that day. Those four games are left out, so all eight teams are forecast on eleven games, which understates the chances of those still short of six. San José State plays thirteen. One FCS rating. Apart from North Dakota State and Sacramento State, every FCS opponent shares a rating, so a strong FCS team is priced like a weak one. A count, not a ruling. Wins over FCS teams count, and eligibility rules, waivers and fill-in selections are not modeled. A slightly later cutoff. More 2026 teams have played six games than in either earlier season, so a 2026 record is compared with tables from a slightly earlier point in the season. Tuesday's games. The two games played on Tuesday, October 13, Delaware at Middle Tennessee and FIU at Jacksonville State, are counted as still to play.
Sources and reproducibility
Final scores and schedules come from ESPN's public scoreboard, site.api.espn.com/, read one date at a time. 2024, 2025 and 2026 through October 3 were retrieved on October 7, 2026 by data_layer/build_ap_polls_2024_2026.py; the rest was retrieved on October 14, 2026 by data_layer/build_six_win_line_2024_2026.py, which writes data_layer/six_win_line_2024_2026.json and refuses to write if any 2026 game through October 12 is unfinished. Every number on this page is recomputed by charts/chart_six_win_line_2026.py, registered in charts/build_charts.py, which runs 154 checks, including the worked example and the 36-setting sweep, and refuses to draw the chart if one fails. As a cross-check, the 2026 records computed from game results match the record ESPN's scoreboard shows for all 100 FBS teams that played between October 9 and October 12 and have not played since.
When the record starts to mean something found that a raw record needs about eight games before it predicts the rest of a season better than a .500 guess, and that margins lead the record by about three games. This piece asks the six-win version of that question and adds the schedule. What a week-one loss actually costs followed 2024's opening-week losers to the same six-win line, and strength of schedule, explained works through a strength-of-schedule calculation on a real schedule.
Minnesota and Penn State meet on November 14 at Penn State. On today's ratings, a Minnesota win there would lift its chance of six to 85%, since it would then need one win from its other five games, and a loss would leave it at 50%. For Penn State the same afternoon is the difference between 95% and 77%. The standings have these two teams a game apart; the game left between them is worth 35 points of probability to one and 18 to the other.