Every September, FBS programs write checks to FCS programs to come to their stadium and, in the standard telling, get run off it — and every September one of those visitors wins and the sport spends a week talking about it. I pulled the 877 completed 2024 games in this site’s cache and measured the transaction. There were 121 FBS-vs-FCS games — 13.8% of the cached season — and they are the most predictable product in college football: the FBS side went 115–6, won by 31.1 points on average (median 31), and shut out the visitor 17 times. But the interesting finding is where the 5% lives. All six upsets landed on Group-of-Five hosts. The power conferences played 61 of these games and went 61–0. When a buy game actually bites, it bites the schools buying the cheapest insurance.
Counting the buy game
The cache’s team objects carry no FBS/FCS label, so classification has to be earned. I used the house proxy — a team is FBS if it appears in 8+ cached games — which yields exactly 134 FBS teams, the true 2024 membership count, and then cross-checked it against the feed’s conference ids: the 134 proxy-FBS teams sit in 11 conference ids (the ten FBS leagues plus independents), the 96 proxy-FCS teams sit in 12 entirely different ids, with zero overlap. A game is a buy game when exactly one side is FBS; the cache’s lone FCS-vs-FCS stray (South Dakota State at North Dakota State, a December playoff game) is excluded.
The census says the ritual is close to universal. 119 of 134 FBS teams played at least one FCS opponent — 117 played exactly one; Hawai’i and UMass played two. The 15 abstainers are a peculiar club — five Big Ten programs (Michigan, Ohio State, Penn State, UCLA, USC) alongside Texas, Notre Dame, Virginia Tech, and a handful of Group-of-Five schools. The geometry is absolute: 96 distinct FCS programs made 121 trips, and not one FBS team returned the visit. Every game was at the FBS team’s stadium except one the feed flags neutral-site — Arkansas–Arkansas-Pine Bluff — and Arkansas was the designated home team there too. Whatever else the fee buys, it buys the venue, every single time.
A season ritual with a calendar
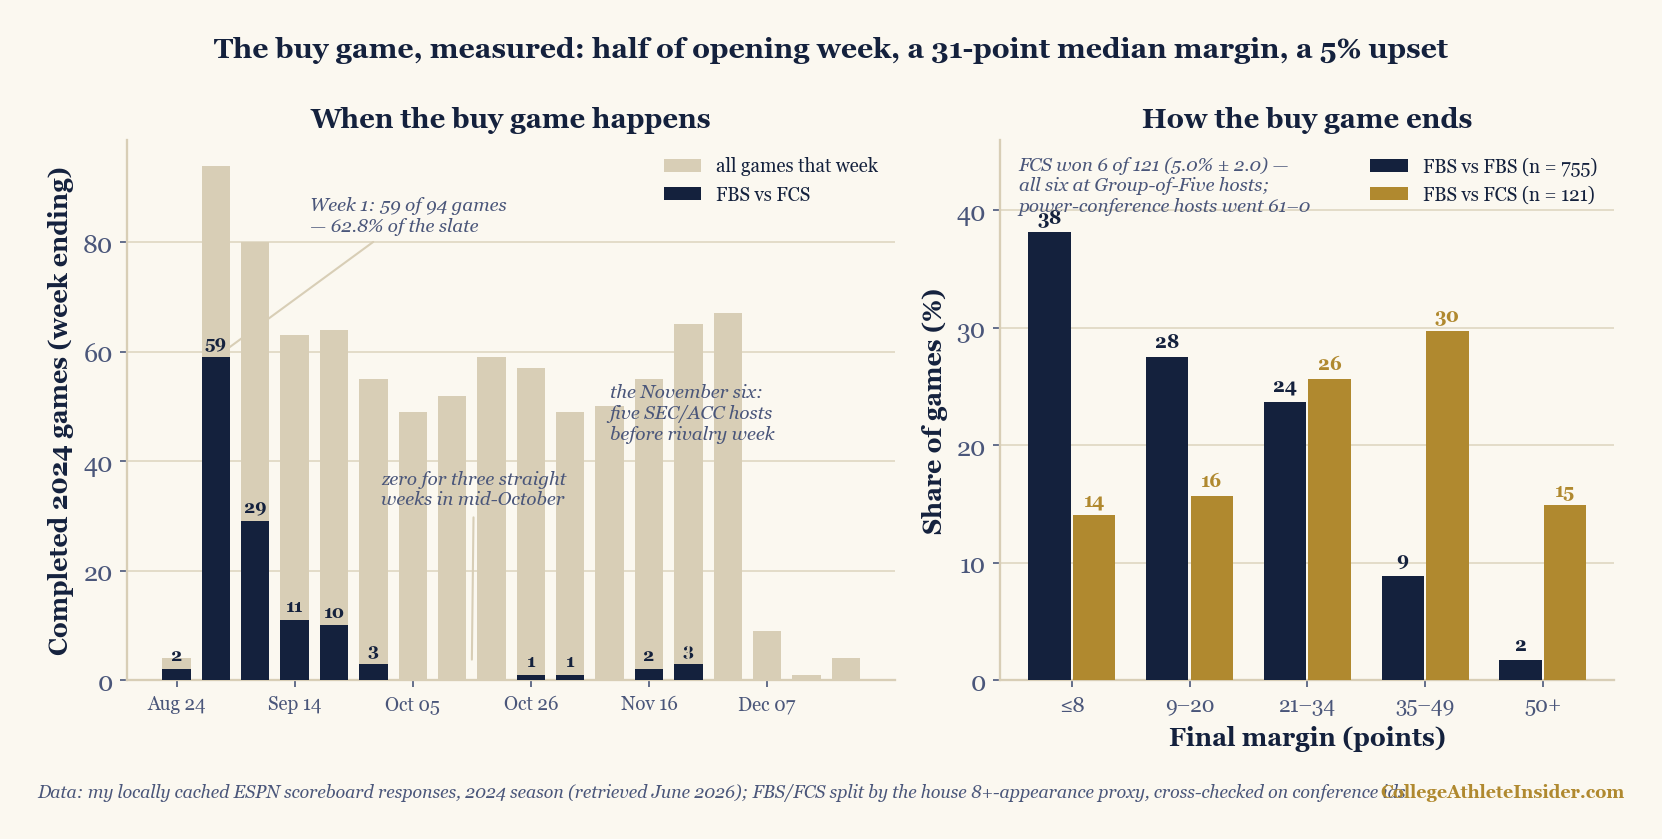
The clustering is stark enough to read as scheduling policy. Week 1 alone held 59 buy games — 62.8% of that week’s 94-game slate, a share so large that the opening-week portrait is mostly a portrait of this product. One convention note, since two pieces on this site count the same week differently: “week 1” here is the Sunday-to-Saturday calendar week (Eastern time) that ends August 31, which holds 94 games. The opening-week portrait uses the Thursday-to-Monday football window, which sweeps in the Labor Day Sunday and Monday games and totals 96. Both windows contain the same 59 buy games; the share is 62.8% of 94 or 61.5% of 96. Opening Saturday had 38 of its 67 games against FCS visitors; opening Thursday had 19 more, the night the weeknight audit found wearing an FCS costume. By September 7, 90 of the 121 — 74.4% — were already played. Then the product disappears: three consecutive mid-October weeks had zero. What remains is the November six, and five of them are the power-conference tune-up week in miniature — Kentucky–Murray State and Alabama–Mercer on November 16, then Florida State–Charleston Southern, Clemson–The Citadel, and South Carolina–Wofford on November 23, the Saturday before rivalry week. The buy game opens the season and greases the end of it; the middle belongs to conference play.
The margin is the product
Set the 121 buy games against the season’s 755 FBS-vs-FBS games and the two distributions barely overlap. The buy game’s average margin was 31.1 points (SE 1.7) from the FBS side’s point of view — and since that side lost only six times, the same games measured as absolute margins, the way the baseline’s 16.4 is measured, average 31.6; the medians are 31 and 14. Nearly half the buy games — 44.6% — were decided by 35 or more, against 10.6% of FBS-vs-FBS games, and 18 of them (14.9%) ended with a margin of 50+, a fate that befell just 13 of the 755 baseline games all season. The average final score was 43.4 to 12.3; fourteen hosts scored 60 or more; 17 visitors — 14.0% — were shut out entirely. The season’s widest margin lived here too: South Alabama 87, Northwestern State 10, the 77-point Thursday outlier the margin census flagged — that piece owns the season-wide margin distribution, and the buy game is the engine of its far-right tail. One honest note: final margins understate the gap if anything, since garbage time compresses some of these scores once the starters sit.
The upset, measured
Six visitors got paid and won anyway — a 5.0% upset rate (±2.0), about one of every twenty checks. The list is worth staring at:
| Date | Result | Margin | Host conference |
|---|---|---|---|
| Aug 24 | Montana State 35, New Mexico 31 | 4 | Mountain West |
| Sep 7 | St. Francis (PA) 23, Kent State 17 | 6 | MAC |
| Sep 7 | Idaho 17, Wyoming 13 | 4 | Mountain West |
| Sep 7 | Southern Utah 27, UTEP 24 | 3 | Conference USA |
| Sep 21 | Monmouth 45, FIU 42 | 3 | Conference USA |
| Sep 28 | UT Martin 24, Kennesaw State 13 | 11 | Conference USA |
Three patterns. First, every host is Group of Five: the 60 buy games bought by Group-of-Five schools produced all six upsets (10.0%) and a 24.1-point average margin, while the 61 bought by power-conference programs and independents produced zero and a 38.0-point average. The tier that can least afford the loss runs the only real risk — and September 7 alone delivered three of the six. Second, when the FCS side wins, it wins close: the largest of the six margins was 11 points. Nobody got run off their own field; the lottery pays out in escapes, not reversals. Third, the near-misses cluster the same way: twelve more hosts survived by one score, including Texas Tech 52–51 over Abilene Christian and Colorado 31–26 over North Dakota State on opening Thursday — Montana State, the visitor that beat New Mexico, ended its season in the FCS title game. Add it up and 17 of 121 buy games (14.0%) finished inside one score, versus 38.1% of FBS-vs-FBS games. The buy game is a fifth as likely to be close, but it is not a bye, and no ordinary home edge explains a 95–5 split — the talent gap does.
The money, honestly
The fee side of the trade lives outside this dataset, so I’ll frame it and stop. These are single-game guarantee contracts; at public universities they surface through open-records requests, and figures reported that way for FBS-vs-FCS visits generally run in the six figures per game. This site publishes numbers it can compute, and the cache holds no contracts, so results-only is the honest frame: in 2024 the average check bought a 31-point win, a 95% certainty, one gate, zero return trips — and, for six Group-of-Five athletic directors, a loss they also paid for.
Where this can mislead you
- One season. Every number is 2024. The 5.0% upset rate carries a ±2.0-point standard error, and the 61–0 power-conference record is a sample, not a law — famous FCS-over-power upsets exist in other seasons; 2024 simply didn’t produce one.
- The classification is a construct. FBS/FCS status comes from the 8+-appearance proxy cross-checked on conference ids. The two methods agree perfectly here, but the cache is an FBS scoreboard: FCS teams appear only when they visit, so nothing in this data describes FCS-vs-FCS football.
- Selection runs the whole market. Hosts choose opponents. Power programs tend to buy overmatched visitors; Group-of-Five schools often buy the top of the FCS — the tier gap in margins and upsets mixes host strength with visitor selection, and this data cannot split the two.
- Final margins, not dominance. Starters sit early in 40-point games, so the margin distribution understates the true gap — the garbage-time caveat cuts one way here.
- No fee data. The economics paragraph is deliberately number-free; nothing in the cache prices a guarantee contract.
The takeaway
The buy game is a ritual with a schedule and a script: 121 games, front-loaded into two weeks, one venue rule with no exceptions, a 31-point median, and a one-in-twenty chance the script flips. The flip risk is not evenly priced — in 2024 it was carried entirely by the Group of Five, while the power conferences bought 61 wins and received 61, at an average of 38 points each. So the next time an FCS upset trends, check the loser’s conference before writing the “anyone can lose these” take. In this season’s data, anyone couldn’t. Specific programs, buying specific tiers of opponent, could — and did, six times, never by more than 11 points.
Reproduce it
The chart above is rebuilt from the cache on every charts build by charts/chart_buy_games.py, which reuses the weeknight audit’s loader, classifies every team by the appearance proxy with the conference-id cross-check, and recomputes every number in this article — the census, the calendar clustering, the margin bands, the tier split, and all six upsets by final score — warning at build time if the cache stops reproducing any of them. The core:
fbs = teams with 8+ cached appearances        # = 134, the real 2024 count
buy = games with exactly one FBS side          # n = 121, one stray excluded
record: FBS 115-6 (95.0%)   margin: mean +31.1, median +31
week 1: 59 of 94 games      by Sep 7: 90 of 121 (74.4%)
upsets: 6, all G5 hosts     power hosts: 61-0, mean +38.0
Sources & further reading
- Data: my locally cached ESPN public-API scoreboard responses (
scripts/cache/, retrieved June 2026; provenance indata_layer/SOURCE.txt) — 877 completed 2024 games through December 21, finals and venues. The cache holds no guarantee-contract figures, which is why the economics paragraph stays number-free. - Every figure above is recomputed from that cache at build time by
charts/chart_buy_games.py, which classifies every team by the 8+-appearance proxy, cross-checks it against the feed’s conference ids (134 FBS / 96 FCS, zero overlap), and warns if any published number drifts. - Related: weeknight football, measured (the loader this piece reuses, and opening Thursday’s FCS costume), the margin census (the season-wide margin distribution this product’s tail feeds), the fourth-quarter lie (the garbage-time caveat), home-field advantage, measured, and opening week, measured (the ten-day slate these games dominate).