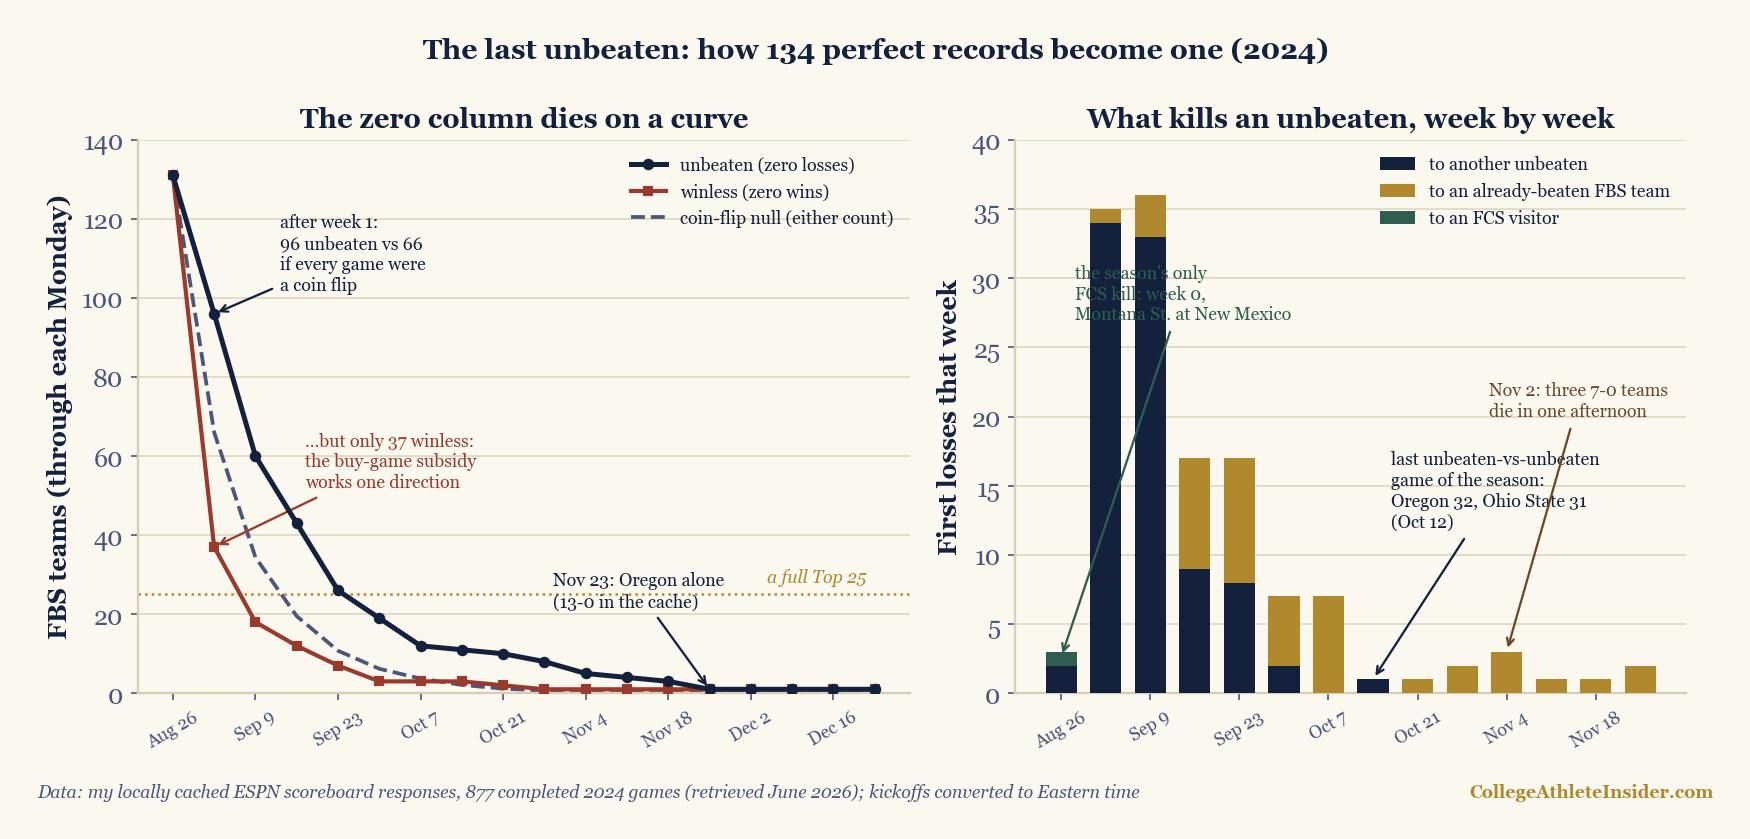
The 2026 season opens Saturday, and for about seventy-two hours afterward roughly a hundred and thirty teams will be undefeated. That is the sport’s most reliable annual illusion, and it has a measurable half-life. Replaying all 877 completed 2024 games in this site’s cache in chronological order gives the exact schedule of its collapse: 134 unbeaten teams become 96 after one week, 60 after two, 26 by late September, 19 by the month’s end, and one on November 23. But the number that reframes the whole thing isn’t on that curve — it’s the comparison. If every 2024 game had been a coin flip, the expected number of teams still unbeaten after week one would have been 66.0. There were 96. And the expected number of teams finishing a whole season perfect would have been 0.030 — a 3% chance that anybody runs the table. One team did. A perfect season is not a lucky streak. It is a structure, and most of the structure is visible in August.
How the replay works
Every completed game in the cache is placed in Eastern-time order, and a running win-loss ledger per team answers, at any instant, who has zero losses. Snapshots are taken through each Monday from August 26 to December 23, so a “week” captures Thursday through Monday — the same through-Monday convention the week-one piece used, which keeps Labor Day games in the week that played them. FBS membership is the house 8-or-more-appearances proxy: 134 teams. The coin-flip null is not a hand-wave either; it takes each team’s real calendar and replaces each result with a 50/50, so a team playing one game in week one has a 0.5 survival chance and a team playing two has 0.25. Summing those gives 66.0 expected survivors, and multiplying each team’s full-schedule survival probability gives 0.030 expected perfect seasons.
charts/chart_last_unbeaten.py — 185 checks.The pool beats chance, because the schedule is built that way
Ninety-six survivors against a null of sixty-six is a thirty-team surplus, and it is bought, not earned. In 2024, teams played 78 games against non-FBS opposition while still unbeaten and won 77 of them — a 98.7% survival rate on nearly a fifth of the unbeaten pool’s early workload. The timing is the tell: 61 of those 78 games were played in August, 17 in September, and none afterwards. The buy game is a subsidy with an expiration date, and the unbeaten curve is the subsidy’s shadow. This is the same mechanism the buy-game piece priced from the other direction, and it explains a small mystery on the left panel: the unbeaten line sits above the coin-flip null all season while the winless line falls below it, crashing from 131 to 37 after one week against the identical 66.0 expectation. The zero column is asymmetric by construction. Nobody schedules a buy game hoping to lose it.
One team did lose it. The only FCS kill of the entire cached season was also the season’s first upset: Montana State at New Mexico, in week zero. That week zero is a fair miniature of the whole finding — six FBS teams played, three lost, exactly what coin flips predict — because week zero is the one weekend without a subsidy to distort it.
Unbeatens don’t mostly get upset. They mostly eat each other.
The right panel sorts all 133 first losses by what caused them, and the split is decisive: 89 came from a team that was itself unbeaten at kickoff, 43 came from an already-beaten FBS team, and 1 came from the FCS. Two-thirds of the destruction is arithmetic rather than misfortune. When two unbeaten teams meet, the pool loses one with certainty, and September’s conference openers pair them by the dozen. This is why the pool halves twice in a fortnight while almost nothing surprising happens.
It is also worth noticing how few of those collisions were between established unbeatens: only 8 of the 89 involved two teams with three or more games already played. The vast majority were early-season pairings of teams whose perfection was two weeks old. The mutual destruction happens before anyone has learned anything — which is the same warning the record-shrinkage piece arrived at from a different direction: a September zero in the loss column is a schedule artifact wearing a uniform.
Then the mechanism inverts. The last unbeaten-versus-unbeaten game of the cached season was Oregon 32, Ohio State 31 on October 12. Every one of the 10 remaining deaths after that date came from an already-beaten team — no more collisions available, only ambushes. November’s attrition is the part that actually looks like the sport’s mythology: on November 2, three 7–0 teams lost in a single afternoon, all three to teams already carrying losses. The early season kills the many by pairing them; the late season kills the few by surprising them.
A worked example: reading the curve on a Sunday
Suppose it’s the last Sunday in September 2026 and you want to know whether a 5–0 team is interesting. Run the 2024 numbers as a base rate. By the September 28 weekend, the unbeaten pool had fallen to 19 — for the first time all year, every unbeaten team in the country fit inside a Top 25 with room to spare. Of those 19, one was still unbeaten eight weeks later. So the honest reading of a late-September 5–0 in this cache is roughly a 1-in-19 shot at perfection, and about a coin flip to survive even to Halloween (19 down to 8 by October 28). That is a real distinction and a modest one: being unbeaten on September 28 is genuinely rare, and it is still mostly not going to end in a perfect season.
Notice what this does not license. It gives you a base rate over the whole 19, not a prediction about any one of them, because the 19 are wildly unequal in schedule difficulty remaining — which is the entire content of a good playoff model and none of the content of this one.
Limits
One season. Every number here comes from 2024. The shape — a fast subsidised start, a September collision phase, a November ambush phase — is structural and should repeat; the exact counts will not. A season with three fewer marquee non-conference collisions ends September with a visibly fatter pool.
The cache is regular season. Oregon finishes this replay 13–0 because that is where the cached scoreboard responses end. What happened afterwards in the playoff is outside this dataset, and the piece makes no claim about it; “the last unbeaten” here means the last unbeaten in 877 cached games, stated exactly.
FBS membership is a proxy. The 8-or-more-appearances rule yields 134 teams, which is right for 2024, but it is inferred from the cache rather than read from a membership table — a team with a heavily-cancelled schedule could in principle fall out of it. The null is deliberately dumb. Coin flips ignore that teams differ, which is the whole point: the gap between 66.0 and 96 is the measurement of how unequal and how curated the early schedule is. A null built from team ratings would close most of that gap and tell you nothing new. And “cause of death” is a status label, not a quality judgment — a loss to an unbeaten team that would finish 6–6 counts as a collision here, because at kickoff that is what it was.
Reproduce it
charts/chart_last_unbeaten.py rebuilds every figure above from the same cached scoreboard responses the rest of this site uses, loading them through chart_weeknight.load_games() verbatim so the game set, the guards and the Eastern-time conversion match the weeknight piece exactly. It runs 185 checks against the published numbers and fails loudly on any drift. The survival curve is a two-line replay; the null is a product of per-game 0.5s over each team’s real calendar; the cause-of-death split reads each team’s first loss and asks what the winner’s record was at kickoff.
Saturday, a hundred and thirty-odd teams start perfect. By the last Monday in September, if 2024 is any guide, the survivors will fit in a Top 25 with six spots to spare, and two-thirds of the departed will have been eliminated by each other rather than by anything anyone would call an upset. The one team still standing in late November will have earned it — and will also have been handed, in August, a game it was never going to lose.
Sources & further reading
- Related chapter: Chapter 18: Game Outcome Prediction, DataField.dev.
- Game results: my locally cached ESPN scoreboard responses, 877 completed 2024 FBS games (retrieved June 2026), loaded through
chart_weeknight.load_games()so the game set and time conversion match the rest of this site. - Replay, null model and cause-of-death ledger:
charts/chart_last_unbeaten.py, which recomputes every number on this page and runs 185 checks against the published values at build time. - Postseason and scheduling context for the buy-game economics: NCAA.com published schedules and results.