Tomorrow night the 2026 season starts filling in its ledger — 91 games between Thursday and Labor Day Monday — and by Sunday morning some fan bases will be writing off their year. So before the panic arrives, I ran the question it depends on through the 877 completed 2024 games in this site’s cache: track every FBS team that lost its opener, and see where it actually finished. The answer splits cleanly in two. The arithmetic cost of a week-one loss is real, exact, and small: one game of slack, the difference between needing five of your remaining eleven and needing six. Everything else the cohort’s ugly-looking numbers seem to say — the collapsed seasons, the missed bowls — is mostly not damage the loss did. It is identity the loss revealed. And the single best piece of evidence is that how badly you lost carried no information at all: teams that dropped their opener by a field goal finished no better than teams that lost it by four touchdowns. Clemson lost its opener by 31 and ended the cached season in the College Football Playoff.
The cohort, stated exactly
Of the 134 FBS teams in the cache (the house eight-appearance proxy), 133 opened between August 24 and Labor Day Monday; Ball State, whose first cached game came September 7, sits this piece out. Those 133 openers produced 96 winners and 37 losers — a 72% win rate, which is the first structural fact about opening week: it is a parade of victories, because 59 of the 96 wins came against FCS visitors who were paid to be there. Losing your opener is therefore lonely almost by construction. Only 36 teams in America lost to an FBS opponent that weekend, plus exactly one — New Mexico — that lost to an FCS side. Hold that one; it gets its own section.
The fates, before any excuses
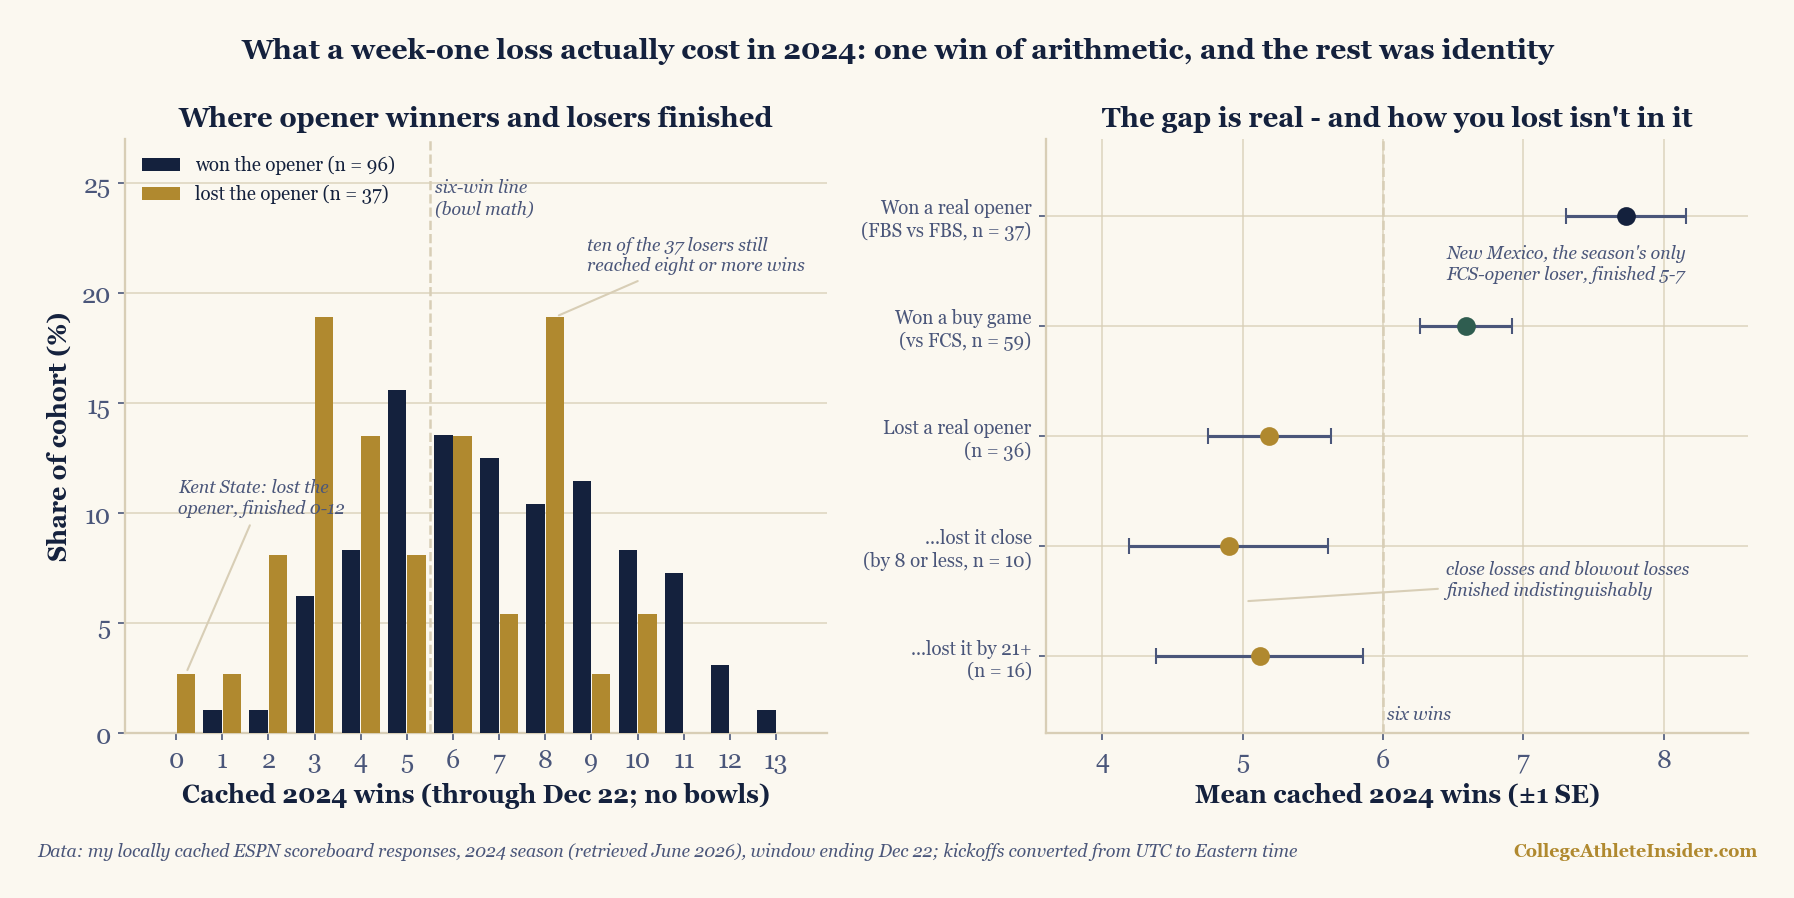
Run the two cohorts to the end of the cached season (through December 22 — the regular season, the conference championships, and three CFP first-round games; no bowls, a window caveat this site always carries). The opener losers averaged 5.19 cached wins against the winners’ 7.03. They reached the six-win line 45.9% of the time against the winners’ 67.7%. They finished with winning records 32.4% of the time against 54.2%. A 1.8-win gap, sorted by one August game — and every one of those numbers is honest, and every one of them, quoted alone to a nervous fan on Sunday, would overstate what the loss itself did.
Composition first: who loses openers
Split the cohorts by what the opener actually was and the picture reorganizes. Teams that won a real opener — FBS against FBS — averaged 7.73 cached wins and reached six 78.4% of the time. Teams that won a buy game averaged 6.59, fully 1.1 wins behind the real-opener winners, because beating an FCS visitor is a participation stamp, not a credential — the opening-week piece measured how little those margins predict. And teams that lost a real opener averaged 5.19. So the total gap between winning and losing a real opener is 2.54 wins — but decompose it. Exactly 1.00 of those wins is the opener itself, mechanically banked by one side and not the other. The rest-of-season gap — the opening-week piece published the rates, 58.9% against 46.0% — comes to about 1.5 wins over the remaining 11.2 games. That win and a half is not something the loss inflicted. It is the two teams’ underlying quality, measured over three more months, showing up exactly where it was always going to. Week-one pairings are not coin flips between equals — Colorado State opened at Texas, Kent State opened at Pittsburgh — and 23 of the 36 real-opener losers lost by 14 or more, which is to say: most opener losers were underdogs doing what underdogs do.
The margin told you nothing
Here is the cleanest version of the identity argument, and the number I’d cite courtside on Sunday. Among the 36 real-opener losers, the ten who lost close — by eight or fewer — averaged 4.90 cached wins and reached six 40% of the time. The sixteen who were blown out by 21 or more averaged 5.12 and reached six 43.8% of the time. The moral-victory cohort finished, if anything, a hair behind the humiliated cohort — on samples of 10 and 16, with standard errors near three-quarters of a win, the honest reading is no detectable difference. The same null shows up in venue: losing a real opener at home (14 teams, 5.43 wins) against on the road (19 teams, 4.79) is indistinguishable once the error bars are drawn. The scoreboard’s job in week one is to tell you that the better team was elsewhere; it is remarkably bad at telling you how much better, and the piece that tested opener margins directly — r = 0.32 against rest-of-season margin, 10% of variance — reached the same verdict from the other direction.
charts/chart_week1_loss_cost.py — every published number re-verified at build.The recovered tail has names
Ten of the 37 losers — 27% — still reached eight or more cached wins, and the list reads like a warning against September obituaries. Clemson lost its opener 34–3 to Georgia on a neutral field and finished 10–4 across 14 cached games, the last of them a College Football Playoff first-round trip: the worst-beaten power-conference team of opening weekend ended its year in the bracket. Ohio lost by 16 at Syracuse and finished 10–3. Jacksonville State lost at home by 28 to Coastal Carolina and finished 9–4. Colorado State took the weekend’s heaviest defeat, 52–0 at Texas, and finished 8–4 — the biggest opening loss in the cohort produced a winning season. LSU and Texas A&M both lost real openers — 27–20 to USC in Las Vegas, 23–13 to Notre Dame — and both finished 8–4. The mirror image is the winners’ column: Purdue beat Indiana State 49–0 on opening weekend and finished 1–11; Mississippi State won its opener 56–7 and finished 2–10. Nobody’s opener, won or lost, was a verdict. It was a matchup.
The one FCS loss, and the panic it didn’t justify
The catastrophe everyone actually fears in week one — losing to the FCS visitor you paid — happened to exactly one of 2024’s 133 opening teams: New Mexico, 35–31 to Montana State on week zero’s Saturday. The Lobos then went 5–7 — a bottom-half season, not a cratered one, and more cached wins than sixteen of the teams that won their openers managed. One team is not a sample, and this piece won’t pretend otherwise; but that is precisely the point. The loss type that generates the loudest sirens was, in the entire season, a single data point with an ordinary ending — and 2026’s week zero has already gone further, promoting the two most dangerous FCS names into FBS and producing an opening weekend where that loss type was structurally impossible. The buy-game machine restarts tomorrow at full volume — 48 of the 91 games — so the opportunity returns. The base rate says almost nobody takes it.
The real cost, worked
So what does the loss itself cost? Bowl math. A 12-game regular season needs six wins. Win your opener and the requirement is 5-of-11 — a .455 clip the rest of the way. Lose it and the requirement is 6-of-11 — .545. That nine-point tightening of the required pace is the entire mechanical price of the weekend, and for most of the cohort it never binds: the good teams clear .545 comfortably (ten losers reached eight wins), and the bad teams weren’t clearing .455 either — Kent State lost its opener 55–24 at Pittsburgh and finished 0–12, a season no scheduling mercy was going to save. The slack matters only to the teams that live at the line, which is exactly what the losers’ distribution shows: a bimodal shape with one mass at three wins and another at eight, and the six-win line running through the thin valley between them.
Limits
One season. This is 2024’s cohort, 133 teams, replayed — base rates from a single year, with standard errors printed precisely because the subgroups get small (10 close losers, 16 blowout losers, one FCS loss). The cache window ends December 22: cached wins include conference championships and three CFP first-round games but no bowls, so “six cached wins” is a bowl-math proxy, not a certified eligibility ruling — real eligibility also counts at most one FCS win, a wrinkle this piece does not adjudicate. Selection cuts both ways: nothing here shows a loss doesn’t hurt — morale, quarterback rooms, and coaching seats are outside the dataset; what the numbers show is that the records that follow a loss are mostly explained by who was losing, not by the losing. And the FBS/FCS split is the house 8+-appearance proxy the buy-game piece cross-checked against conference IDs.
Reproduce it
charts/chart_week1_loss_cost.py rebuilds the figure and re-verifies every number above — the cohort counts, all eight cohort fate lines, the decomposition, the named seasons down to their opener scores, and both distributions — against the cache at build time, warning loudly on any drift. The loader is chart_weeknight.load_games() verbatim, so the game set, the UTC-to-Eastern conversion, and the guards match the unbeaten piece, the weeknight piece, and the opening-week piece exactly; the rest-of-season win rates cited from that last piece reproduce here to the decimal.
Tomorrow the 0–1 club starts taking members — roughly 40 of them by Monday night, if the slate’s shape holds. When yours joins, here is the whole playbook: subtract one game of slack, check whether the team that beat you was any good, and ignore the margin entirely. Then wait, because the record won’t tell you who your team is until November — and the one thing a week-one loss has never once done, in this cache, is decide.