The 2026 season has now produced nineteen final scores, all of them on Thursday night and Friday night, and I want to make a claim about them that is meant as a compliment to the schedule-makers: sixteen of the nineteen were decided before anyone kicked off. Not by me, and not by a model — by the matchup sheet. I wrote down the crudest possible rule that uses no results at all (take the home team, unless the visitor is ranked and the host is not), applied it to the opening weeknight window, and it went 16–3. All three misses came from the same bucket: the six games where both sides were FBS and neither was ranked. That bucket went 3–3. Everything else — thirteen games, and 88% of the weekend’s entire supply of winning margin — was arithmetic the calendar had already done.
The window, stated exactly
This measures a closed set, not a season. data_layer/build_week1_2026_weeknights.py walked ESPN’s public FBS scoreboard for UTC days September 1 through 5, converted every kickoff to Eastern time, and kept only completed games whose Eastern date was Thursday September 3 or Friday September 4. That returned 19 games — 11 Thursday, 8 Friday — which is exactly the Thursday/Friday count the pre-kickoff slate piece published a week ago. The same week’s Saturday and Monday games were still being played while I wrote this and are deliberately not in the file. No neutral sites, one conference game (Miami at Stanford). Twenty-eight FBS teams have played at all.
The rule, and why it is deliberately stupid
The rule has two clauses and no coefficients: pick the home team; if the visitor is ranked and the host is not, pick the visitor. It has no ratings, no spread, no memory of last season. It answers one question — how much of an opening weeknight can you call from the schedule alone? — and it is thin on purpose, so that any accuracy it shows belongs to the calendar. Rankings come from ESPN’s curatedRank field, recorded verbatim, 99 meaning unranked; I use it only to label a side as ranked, never to invent a margin.
Three tiers, and only one of them is football
Sorting the nineteen by what the schedule knew produces three groups that barely resemble the same sport. Ten were guarantee games — a paid non-FBS visitor — and the hosts went 10–0 by an average of 41.6 points, with nine of the ten finishing 21 points or wider. Three had exactly one ranked side, and the ranked side won all three by 51, 39, and 39. Six had no ranking on either side — the blind tier — and there the average winning margin was 12.3, the median 13, and the home teams went 3–3.
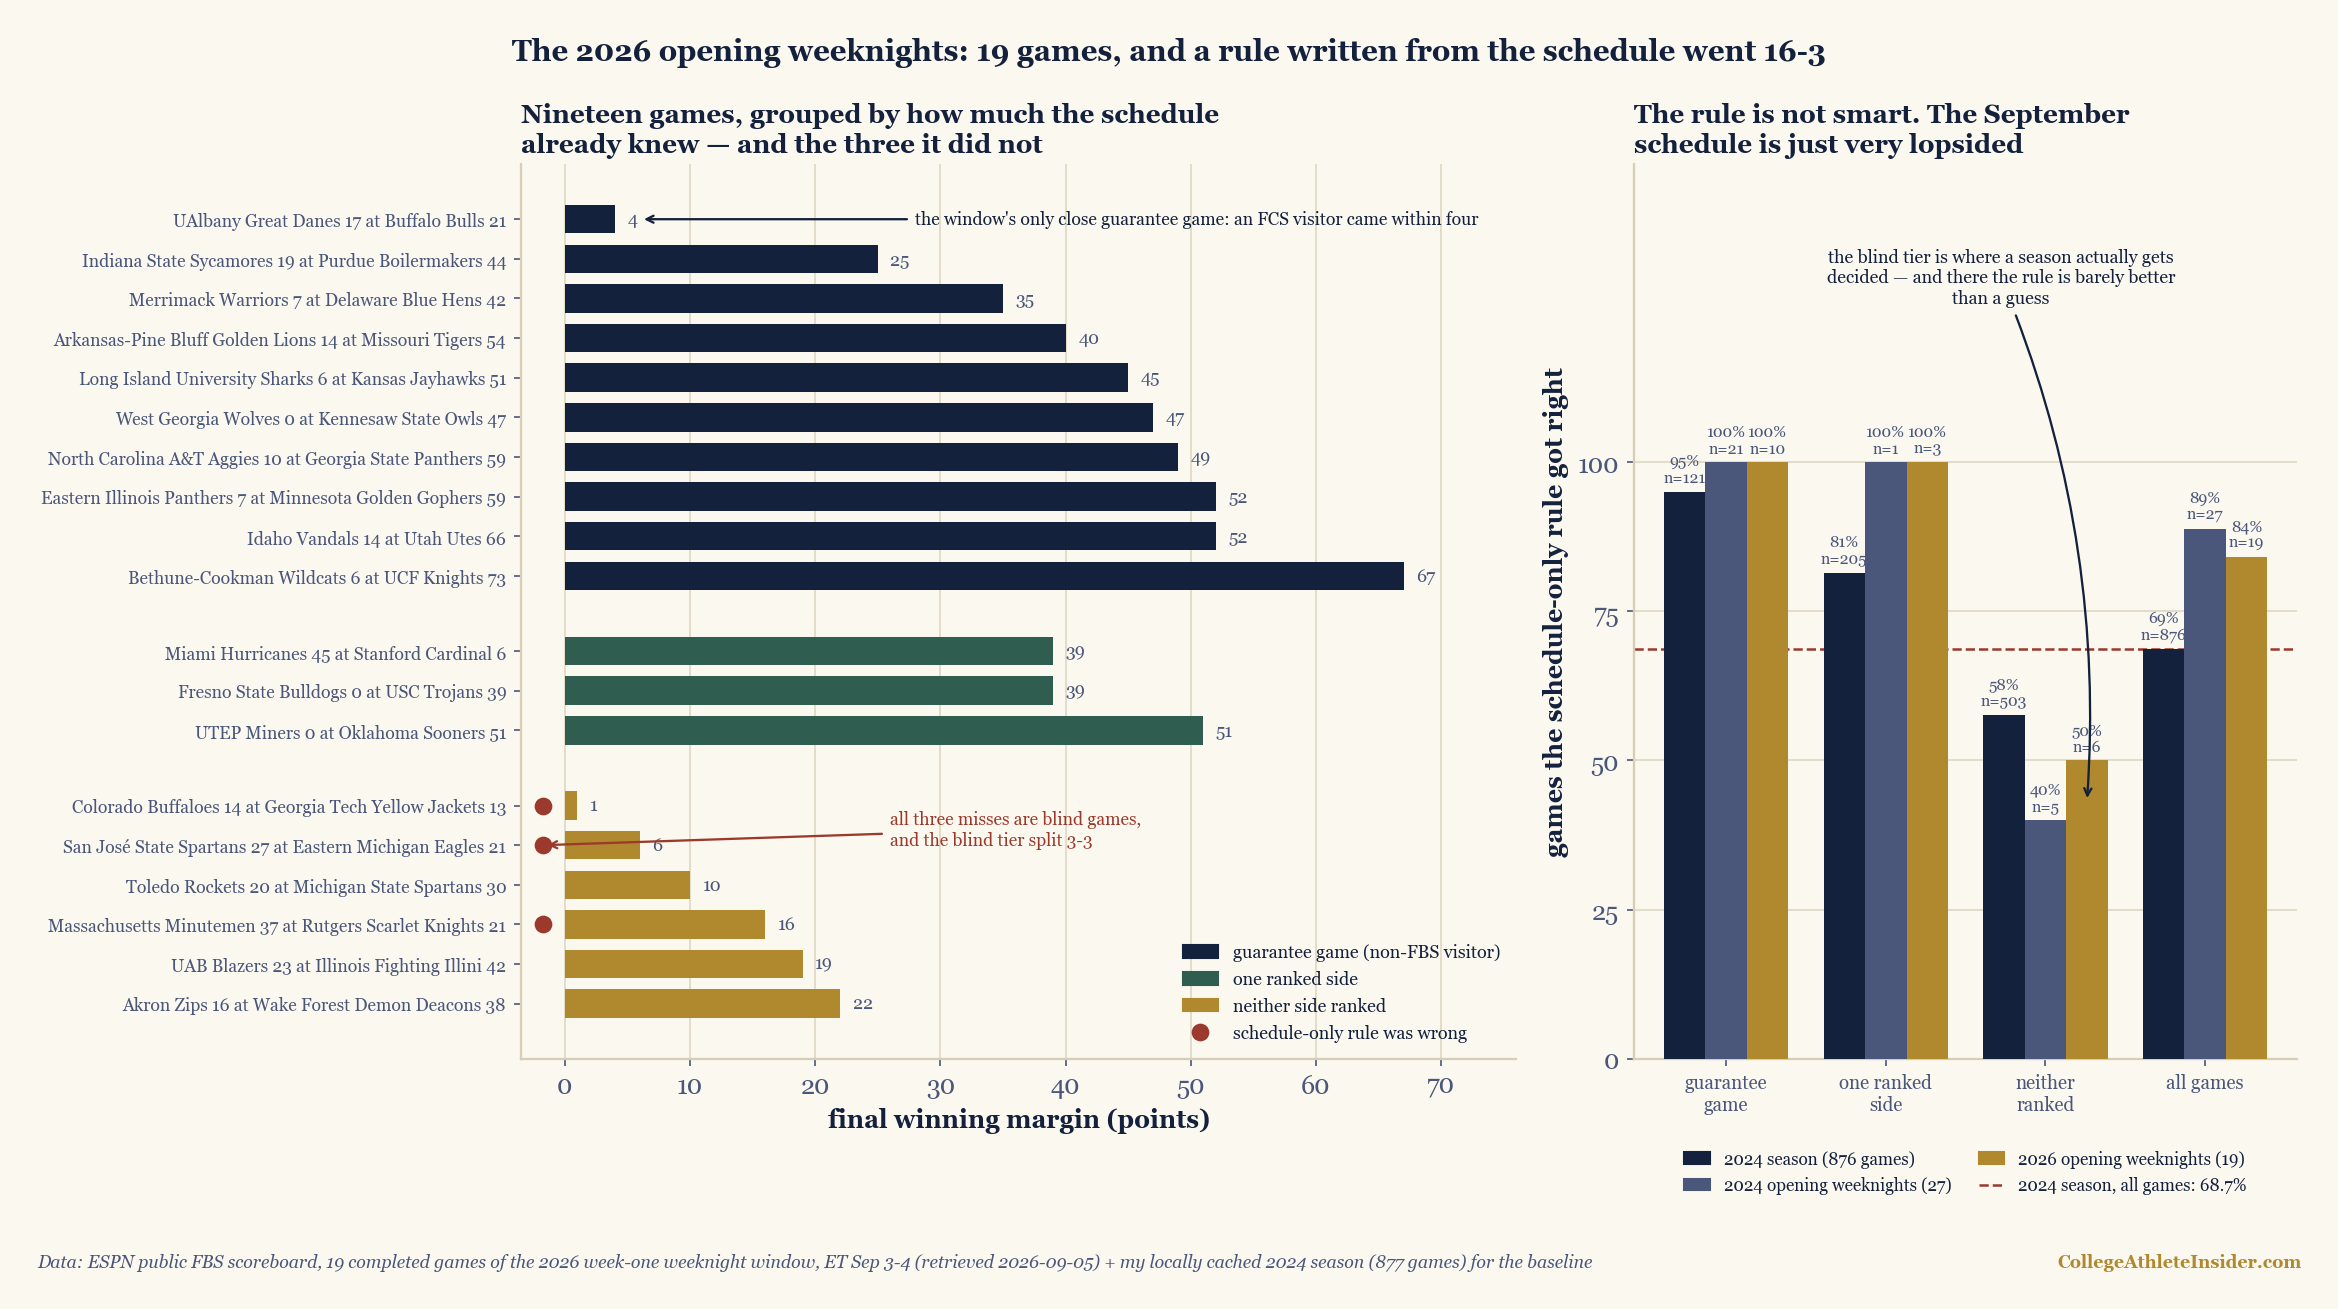
charts/chart_week1_2026_nights.py — 156 checks.| Tier | Games | Home W–L | Avg margin | Median | One-score | 21+ | Schedule rule |
|---|---|---|---|---|---|---|---|
| Guarantee game | 10 | 10–0 | 41.6 | 46 | 1 | 9 | 10–0 |
| One ranked side | 3 | 2–1 | 43.0 | 39 | 0 | 3 | 3–0 |
| Neither ranked | 6 | 3–3 | 12.3 | 13 | 2 | 1 | 3–3 |
| All 19 | 19 | 15–4 | 32.6 | 39 | 3 | 13 | 16–3 |
The six games that counted
Twelve FBS teams played a game the schedule could not call, and those twelve produced almost all of the window’s competitive content. Colorado won 14–13 at Georgia Tech, the only game of the weekend decided by a single point. Massachusetts won 37–21 at Rutgers and San José State won 27–21 at Eastern Michigan. Those are the three misses, and they share a shape: the visitor won a game where the schedule gave no reason to prefer either side, so the rule fell back on home field and lost. Wake Forest, Illinois, and Michigan State held serve, which is what made the tier 3–3. A 3–3 split on six games carries a standard error of 20.4 percentage points; the split is not a finding, and I would not read a conference’s health into it.
Notice what the misses were not. Not one ranked team lost — the five ranked sides on the weeknight slate (Missouri, Utah, Oklahoma, USC, and Miami) went 5–0 by margins of 40, 52, 51, 39, and 39. And no FCS visitor won, though one came close: Buffalo survived UAlbany 21–17, the only guarantee game in the window that finished inside one score. Everything else in that tier worked as designed, out to UCF 73, Bethune-Cookman 6. The window’s three shutouts all came from the two easy tiers: Kennesaw State 47–0, Oklahoma 51–0, USC 39–0.
The same window, two years apart
None of this is new to 2026. Replaying the identical calendar slot from my cached 2024 season — Eastern Thursday August 29 and Friday August 30, 27 games, 21 Thursday and 6 Friday — the rule went 24–3, or 88.9%. It went 21–0 in that year’s guarantee games, 1–0 in the single game with a ranked side, and 2–3 in the five blind games, whose average margin was 11.4 against the window’s overall 31.9. Two years, two different sets of teams, one structure: the blind tier is small, close, and roughly a coin flip, and everything around it is decided in the spring by an athletic director with a checkbook. Pool the two opening windows and the blind tier is 11 games, home teams 5–6.
Why 84% is about to become 69%
Here is the part that matters for the rest of the season. Run the same rule and the same tiers over all 876 cached 2024 games with at least one FBS side and the accuracy collapses to 68.7%. The per-tier rates barely move — 95.0% in guarantee games, 81.5% with one ranked side, 63.8% in ranked-versus-ranked, and 57.7% in the blind tier over 503 games. What changes is the mix. Guarantee games were 52.6% of this weeknight window and are 13.8% of a full season. The opening weeknights look predictable because they are stocked almost entirely from the two tiers where prediction is trivial; by November the blind tier is nearly all that is left, and a rule that cannot tell two unranked teams apart is worth about eight points of edge over a coin. That is the same lesson from the other direction as the piece on when a record starts to mean something, and it is why the sport’s season-long average winning margin is 18.5 while this window’s was 32.6.
Limits
Nineteen games. Every 2026 figure here is a census of a closed window, not an estimate; the subgroup counts (10, 3, 6) are far too small to support a claim about a conference, a coach, or a season. The 2024 comparison is one cached season whose window ends December 22 and whose FBS membership is the house 8+-appearance proxy; the 2026 side cannot use that proxy on 19 games, so it classifies by the conference-id set the proxy produces, which is why a first-year FBS host like Delaware counts as FBS and Idaho does not. The rankings are ESPN’s, and a preseason poll is a reputation instrument, not a measurement — part of why the rule works at all is that pollsters and schedulers are reading the same information. And the rule is not a prediction system: no probabilities, so it can be scored for wins and losses but not for calibration. A real rating would beat it in the blind tier, the only tier where beating it is hard.
Reproduce it
data_layer/build_week1_2026_weeknights.py pulls the window (the only network step) and charts/chart_week1_2026_nights.py rebuilds the figure while re-verifying 156 checks against the numbers printed above — every tier row, both years, all three named misses, and the day census. The 2024 side uses chart_weeknight.load_games() verbatim, so the game set and the UTC-to-Eastern conversion match the weeknight census and the opener-loser cohort exactly; as an external check, the same loader reproduces the buy-game piece to the game — 121 paid visits, FBS side 115–6, average margin 31.1, median 31, 17 shutouts. If you want a tool that actually does what this rule cannot, the Elo and rating calculators on the calculators page separate two unranked teams the only way anyone can: by making them play.
So the ledger after nineteen games reads: no ranked team lost, no FCS visitor won, thirteen games ended by three scores or more, and the schedule called 84% of it without watching a snap. The three games it missed are the only three that told me anything, and what they told me was small. This afternoon the window opens properly — sixty-eight Saturday games, most of them still guarantee stock — and the rule will keep looking clever for another few weeks. Save the verdicts for when it stops.