The most informative number about Virginia Tech’s 2026 season is not James Franklin’s 128 career wins, and it is not the $41.75 million Blacksburg will pay him through 2030. It is minus 14.1 — the per-game scoring swing between the 2024 team (outscored nobody’s idea of good, but only +5.3 a game net against its schedule) and the 2025 wreck that went 3–9 and was outscored by 8.8 points a game. Coaching changes get narrated as clean slates. The measurable reality is that Franklin inherits the roster and the margins of the worst Virginia Tech team in decades, opposite a 2026 schedule that is — by the actual 2025 records of the teams on it — the gentlest on-ramp the ACC could have drawn him. Both of those facts are checkable, so this piece checks them.
What 3–9 actually was
Pull Virginia Tech’s last two seasons from ESPN’s public schedule API and line up the margins, and you get two different kinds of bad. The 2024 team finished 6–7, and its six regular-season losses came by 7, 3, 4, 7, 10 and 3 — every single one by ten points or fewer, an average of 5.7. That is the profile of a coin-flip team that lost the flips. The 2025 team finished 3–9, and its nine losses averaged 16.3 points, with exactly one inside ten. That is not variance. That is a team that was worse than nearly everyone it played.
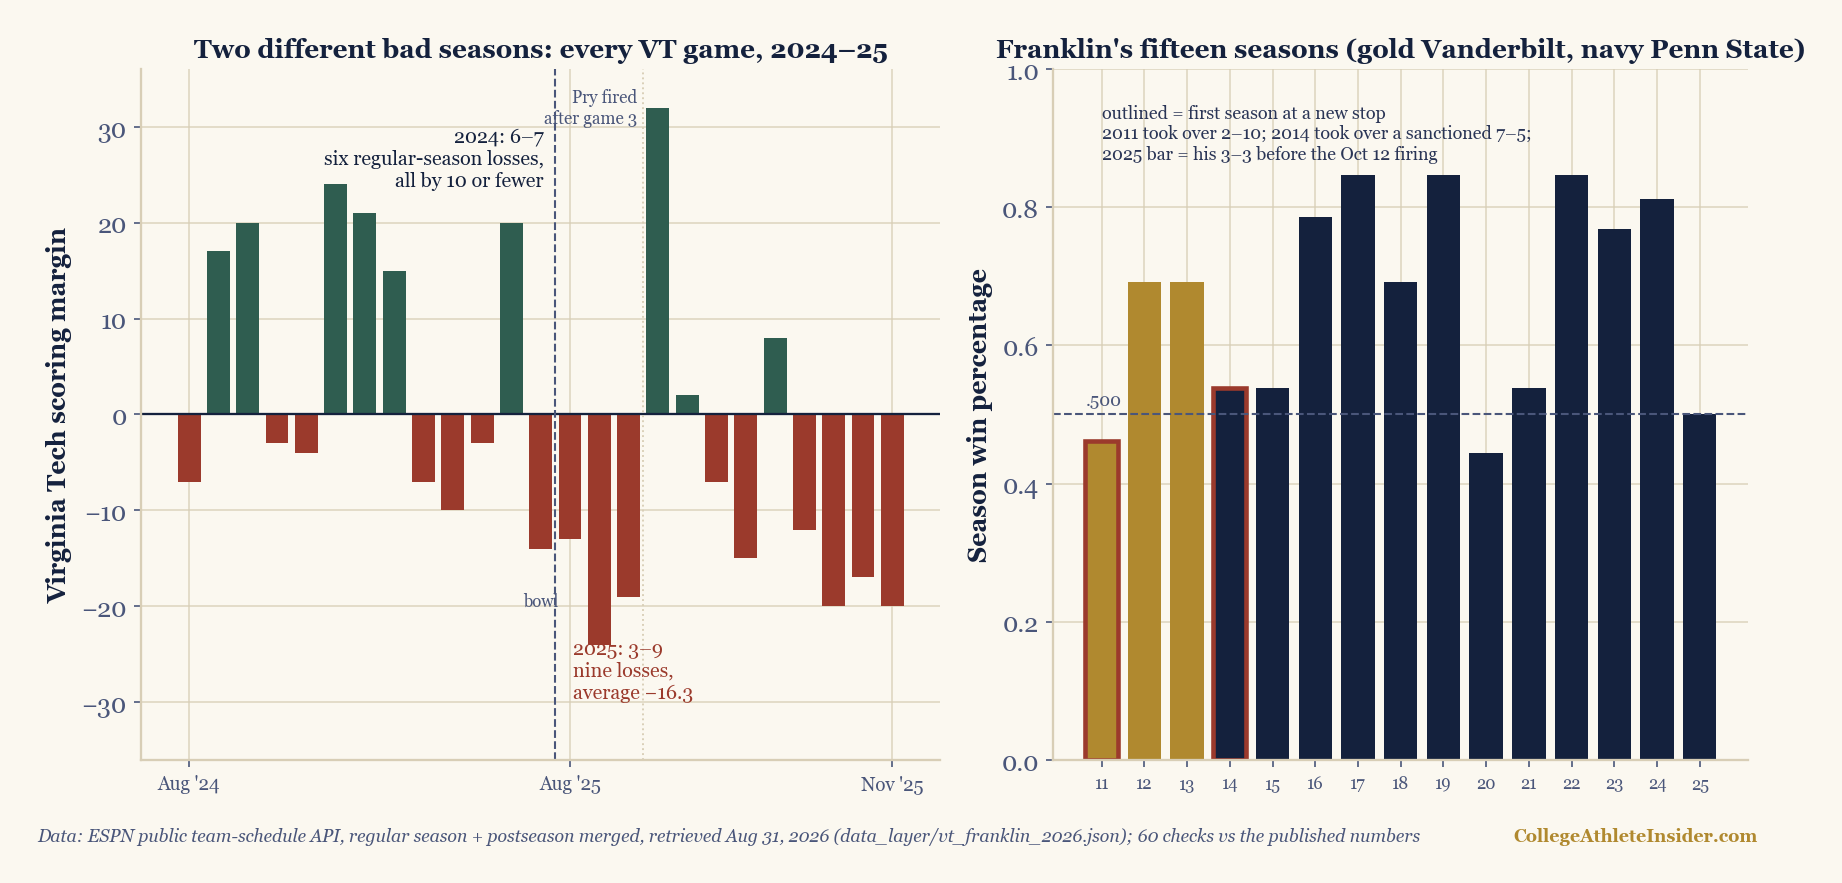
charts/chart_vt_franklin.py — 55 checks.The season split in two on a specific weekend. Brent Pry’s three games — a neutral-site loss to South Carolina, then home losses to Vanderbilt and Old Dominion — went 0–3 with an average margin of minus 18.7, and the last of them, 26–45 to Old Dominion in Lane Stadium on September 13, ended his tenure the next day at 16–24 across four seasons. Philip Montgomery’s interim stretch went 3–6 and produced all three wins: Wofford (an FCS opponent, by 32), a two-point escape at NC State, and a 42–34 shootout over California. From November 1 on, the closest loss was by 12. Whatever else the interim months proved, the team’s November margins — 12, 20, 17 and 20 — belong to the same species as September’s.
What Franklin’s fifteen seasons actually say
Franklin arrived on November 17, 2025 — 36 days after Penn State fired him at 3–3, on a five-year, $41.75 million deal effective November 15 and running through December 2030. The resume argument for the hire is genuinely strong, and it is worth stating precisely rather than in press-conference language. Counting every game through his October 12 firing, Franklin is 128–60 as a head coach: 24–15 at Vanderbilt from 2011 to 2013, 104–45 at Penn State from 2014 into 2025. At Penn State from 2016 through 2024 he posted six seasons of double-digit wins in nine years, and excluding the five-win COVID season his floor across his last ten full seasons there was seven wins. Sustained, high-floor competence is the single best-documented fact about him.
Two other facts matter more for 2026, though, and they cut in different directions. First: Franklin has never taken over a healthy program. Vanderbilt had gone 2–10 the season before he arrived; Penn State was a 7–5 team still carrying scholarship sanctions; Virginia Tech hands him a 3–9. Taking bad jobs and stabilizing them quickly is, on the record, his specific skill. Second: the stabilization has never been instant. His first Vanderbilt team went 6–7. His first Penn State team went 7–6. Both landed within a game of .500, and both preceded the real jump — Vanderbilt hit 9–4 in year two, Penn State reached 11–3 and a conference title in year three. Fifteen seasons of evidence say the honest expectation for a Franklin year one is not a revival. It is respectability, with the referendum scheduled for years two and three.
The one thing his record cannot tell you is how he performs at this assignment in reverse. Penn State fired him at 3–3 — after a 3–0 start, an overtime loss to Oregon, and consecutive upsets by UCLA and Northwestern — which is to say it fired him over a ceiling: twelve years of seven-plus-win floors that kept not becoming championships. Virginia Tech is hiring him to raise a floor. Fifteen seasons of evidence speak directly to the second problem and barely at all to the first, which, for once, is the comfortable direction for that asymmetry to run.
The 2026 slate is a ramp, and the ramp is steep
Now put the schedule next to that. The twelve teams on Virginia Tech’s 2026 slate went a combined 85–71 (.545) in 2025, postseason included — but the average hides the structure. September’s four opponents (VMI, Old Dominion, at Maryland, at Boston College) went 17–32 (.347). October’s four (Pittsburgh, at California, Georgia Tech, at Clemson) went 31–21 (.596). November’s four (at SMU, Stanford, at Miami, Virginia) went 37–18 (.673). The season gets harder nearly every week it runs. Four opponents won four or fewer games last year; five won nine or more, and four of those five sit in the back half of the schedule.
The opener is the purest version of the pattern: VMI, an FCS program that went 1–11, in Lane Stadium on September 5 — precisely the subsidy game the buy-game piece priced, the unbeaten-survival replay showed FBS teams win at a 98.7% clip, and the week-one slate piece maps across the sport’s whole opening weekend. A week later comes the game with actual information in it: Old Dominion, which went 10–3 last season and won 45–26 in Blacksburg last September — the loss that got Pry fired. The Hokies also get one Friday-night date (Pittsburgh, October 2, the shortest-rest slot the weeknight piece measured), a single bye on Halloween weekend, and a finale against a Virginia team that just went 11–3. The road half is honest work: California, Clemson, SMU and a 13–3 Miami that made the playoff’s deep end.
A worked example: the arithmetic of 7–5
Skip prediction and just do the band arithmetic. Group the slate by 2025 record: four games against teams that won ≤4 (VMI, Boston College, Maryland, Stanford), three against 7–8 win teams (Cal, Clemson, Pitt), five against 9+ win teams (ODU, Georgia Tech, SMU, Miami, Virginia). A 7–5 season — the classic year-one-respectability number, and exactly where Franklin’s first seasons landed twice — requires sweeping the soft four and going 3–5 against everyone else. A bowl at 6–6 requires the sweep plus 2–6. For calibration: nine of the 2025 team’s twelve opponents finished with winning records, and it went 2–7 against them — while also going 0–2 against the two FBS teams on its schedule that finished losing (a 4–8 South Carolina and a 5–7 Florida State), with an FCS visit supplying the third win. The gap between “this roster plus a famous coach” and 7–5 is not one big upset. It is the routine, unglamorous work of not losing by 16 to mid-tier ACC teams — five or six times in a row.
What will count as evidence, and when
Virginia Tech sat out week zero (measured here), so its season starts with the subsidy intact: by September 26 it will likely have been favored in at least three of its first four games, and a 3–1 September is therefore close to the schedule’s default outcome — the record-shrinkage piece is the standing warning about reading anything into that. The evidence lives in the margins, not the record. Last year this program lost to Old Dominion by 19 at home; it lost its nine games by 16.3 on average. If the September 12 rematch is a one-score game in either direction, the floor has already moved roughly two touchdowns, whatever the scoreboard says. If October’s four-game gauntlet — combined 2025 record 31–21 — produces losses that look like 2024’s (single digits) rather than 2025’s (double digits), the reset is real even at 5–5. And the November closing stretch against .673 opposition is where a seven-win season will actually be decided, which is the schedule-maker’s small mercy: the referendum arrives after ten games of evidence, not before.
Limits
Last year’s records are not this year’s teams. Every opponent strength number above is a 2025 final record attached to a 2026 roster that the portal has since rewritten — ODU’s 10–3 and Stanford’s 4–8 are priors, not measurements. The portal piece is the standing account of how much churn that implies. This piece says nothing about the 2026 roster on purpose. Returning-production and portal-haul claims circulating in August are unverifiable marketing until depth charts exist; the returning-production piece covers why the number matters and how badly preseason versions of it travel. Coaching-change effects resist clean measurement. Franklin’s two prior first seasons are a sample of two, at different schools, in a different NIL era; they anchor expectations, they do not predict. And the margins framework cuts both ways — 2024’s close losses looked like bad luck and preceded a collapse, which is the standing reminder that a one-score profile is a description, not a floor.
Reproduce it
data_layer/build_vt_franklin_2026.py pulls Virginia Tech’s 2024–25 game logs, the full 2026 slate, every 2026 opponent’s 2025 record, and Franklin’s fifteen season records (2025 truncated to his games) from ESPN’s public team-schedule API, regular season and postseason merged, verifying every team’s name before counting its games. charts/chart_vt_franklin.py recomputes every number in this article from that snapshot and runs 55 checks against the published values — including reconciling the pulled per-season records exactly against Franklin’s independently reported career totals (24–15, 104–45, 128–60) — and fails loudly on any drift.
Virginia Tech paid a reported $6.8 million to stop the Pry era and $41.75 million to start this one. The 2026 schedule will make the first two months feel like the money worked. The measurement that matters starts on September 12 against the team that ended the last regime, and it is a margin, not a win.
Sources & further reading
- Chapter 18: Game Outcome Prediction — DataField.dev.
- Game logs, 2026 slate, opponent records and Franklin season records: ESPN public team-schedule API (site.api.espn.com), regular season + postseason merged, retrieved August 31, 2026; snapshot at
data_layer/vt_franklin_2026.json. - Hiring and contract: Virginia Tech Athletics announcement (Nov 17, 2025); WSLS: contract details (five years, $41.75M, effective Nov 15, 2025).
- The firings: CNN: Penn State fires James Franklin (Oct 12, 2025); SI: Virginia Tech fires Brent Pry after 0–3 start (Sep 14, 2025), including the buyout figure.
- Replay and checks:
charts/chart_vt_franklin.py— recomputes every number on this page at build time.