College football’s calendar mythology says Saturday is the real sport, Thursday is where mismatches go, and Tuesday — MACtion — is a punchline that occasionally eats a ranked team. I pulled the 877 completed 2024 games in this site’s cache, put every kickoff on the correct Eastern-time day, and measured each night against the Saturday baseline. The week turns out to be three different products: Tuesday played the closest football of 2024 (10 of its 19 games finished one-score), Thursday played the ugliest (67.5% blowouts, and stripping the FCS bodybag games only gets it to 60%), and Friday quietly beat Saturday on every closeness measure I computed. Underneath all of it, the “weeknight chaos” reputation fails its audit: the better team won 72.1% of weekday FBS-vs-FBS games and 70.5% of Saturday ones — a 1.6-point difference on a 4.6-point standard error. Upsets are not more common on weeknights. They are just more visible, because they are the only game on.
First, get the day of the week right
The trap goes first: ESPN’s feed stamps kickoffs in UTC, so an 8:00 p.m. Eastern kickoff lands on the following UTC day. Split the season by the raw date stamp and 205 of the 877 games — 23.4% — sit on the wrong day: every Saturday-night game becomes a phantom Sunday game, and Friday night migrates into Saturday. So charts/chart_weeknight.py converts every kickoff to Eastern time (UTC−4 through November 2, UTC−5 after the clocks change) before assigning a day, with an external check: the overtime census published its 35 overtime games as 26 Saturday, 5 Friday, and 4 Tuesday Eastern, and this script reproduces that split exactly.
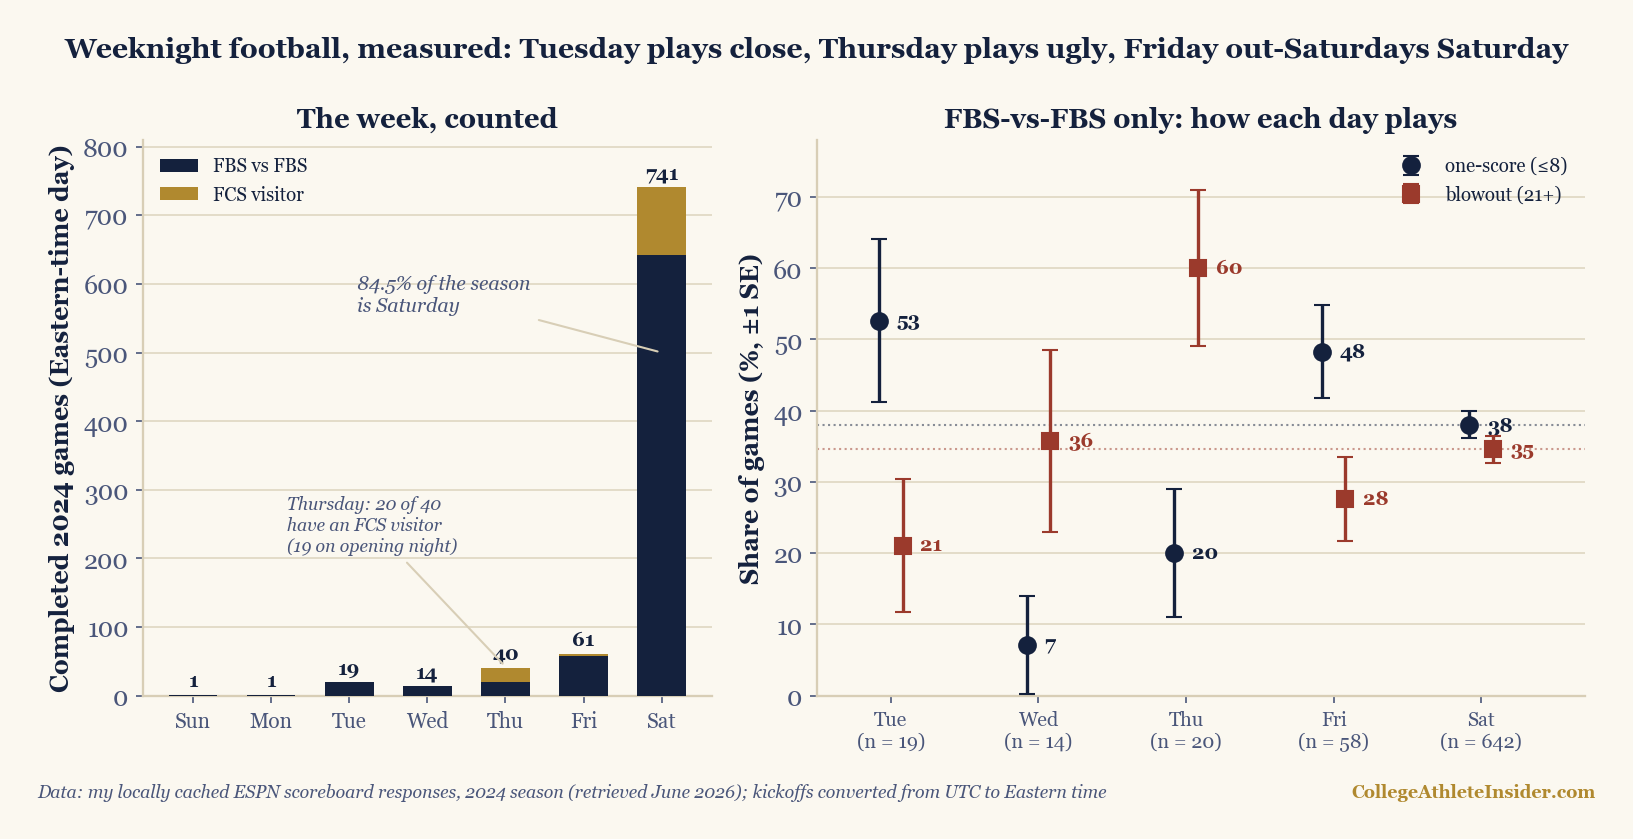
The corrected census: 741 games on Saturday — 84.5% of the season — then 61 Friday, 40 Thursday, 19 Tuesday, 14 Wednesday, and one each on Sunday (USC–LSU) and Monday (Boston College–Florida State), both on opening weekend. The 134 Tuesday-through-Friday games are 15.3% of the season and genuinely a night product: 123 of 134 kicked off in the evening, and all 11 afternoon exceptions fell on the Friday after Thanksgiving. Who plays them is just as lopsided. The SEC appeared in five weekday games all season and played exactly one weekday conference game, the Egg Bowl on Black Friday. Tuesday and Wednesday belong entirely to the MAC, Conference USA, and the Sun Belt; Friday is where the Big Ten, Mountain West, and ACC park their weeknight inventory.
| Day | Games | Avg total | Avg margin (SE) | Median margin | One-score | Blowout |
|---|---|---|---|---|---|---|
| Tuesday | 19 | 41.3 | 11.4 (2.2) | 7 | 52.6% | 21.1% |
| Wednesday | 14 | 50.2 | 19.5 (3.0) | 17 | 7.1% | 35.7% |
| Thursday | 20 | 58.7 | 20.6 (2.5) | 24 | 20.0% | 60.0% |
| Friday | 58 | 53.8 | 13.7 (1.6) | 10.5 | 48.3% | 27.6% |
| Saturday | 642 | 53.9 | 16.6 (0.5) | 13.5 | 38.0% | 34.6% |
Tuesday: rock fights, not shootouts
MACtion’s reputation is weirdness and points. The 2024 sample says the opposite on both counts. Tuesday’s 19 games — every one FBS-vs-FBS, all MAC, Conference USA, or Sun Belt — were the lowest-scoring night of the week at 41.3 combined points (median 40) against Saturday’s 53.9, and not one reached 100: the ceiling was Buffalo 51, Ball State 48 on November 12. What Tuesday delivered instead was closeness: 10 of 19 games one-score (52.6%), a median margin of 7 points against Saturday’s 13.5, and only 21.1% blowouts. The honest caveat: n = 19 carries an 11.5-point standard error, so 52.6% versus Saturday’s 38.0% is about 1.3 SE — suggestive, not proof. Wednesday is the warning label: its 14 games (same conferences, same slot) produced exactly one one-score finish, Kennesaw State 27, Liberty 24. Pool the two midweek nights and you get an ordinary 33.3%. Tuesday being close is real in this sample; Tuesday being specially close is one season away from being noise.
Thursday: the carnage is mostly a costume
Thursday 2024 was a massacre on paper — a 29.7-point average margin, 67.5% blowouts, 12.5% one-score — and most of that is a scheduling artifact. Twenty of the 40 Thursday games had an FCS visitor, and 19 landed on one night: Thursday, August 29, opening night, when 21 games kicked off and the FBS hosts went 19–0 with a 38.8-point average margin in the paid visits (Arkansas’s 70–0 over Arkansas–Pine Bluff was technically neutral-site, so it escapes even that record). The season’s widest margin was also a Thursday: South Alabama 87, Northwestern State 10 on September 12 — the 77-point outlier the margin census flagged. But here is the part I did not expect: filter to FBS-vs-FBS and Thursday stays ugly — 60% blowouts and a 24-point median margin across its 20 real games, the worst of any night, though at n = 20 the standard error is 11 points and one season cannot separate “Thursday inventory is mismatched” from bad luck.
Friday: the best football nobody defends
Friday is the night the sport apologizes for — high schools complain, traditionalists complain — and it produced the most watchable slate of 2024. Its 61 games were nearly all real — 58 of 61 FBS-vs-FBS, against Saturday’s 87% — and those 58 finished within one score 48.3% of the time against Saturday’s 38.0%, with a 13.7-point average margin against 16.6 and a median of 10.5 against 13.5. That gap is 1.5 SE — the same “suggestive, not settled” tier as Tuesday. What is not in doubt is the quality of the inventory: Friday 2024 held the Egg Bowl, Georgia’s 44–42 eight-overtime escape against Georgia Tech — the deepest game of the season — three of the nine conference championship games (Mountain West, American, Conference USA, all December 6), and the entire Boise State–UNLV series, played twice, both Fridays, 29–24 and 21–7. If you wanted 2024’s highest one-score rate on a sample big enough to mean something, you stayed home Friday.
The upset myth, audited
The load-bearing claim about weeknights is that they are where chaos lives. So I ran the boring test: call the “better team” the one with the higher season scoring margin computed excluding the game in question, and ask how often it won. Saturday, FBS-vs-FBS: 452 of 641, 70.5%. Weekdays: 80 of 111, 72.1% — a +1.6-point difference on a 4.6-point standard error, nothing, in the same family as the better-offense audit’s findings. Home teams won 59.5% of both buckets — 371 of 624 on Saturday, 66 of 111 on weekdays, identical to the decimal, consistent with the home-field piece. Aggregate all 111 weekday FBS-vs-FBS games and the night product is statistically indistinguishable from Saturday: 38.7% one-score versus 38.0%, 33.3% blowouts versus 34.6%, 15.3-point margins versus 16.6. A Tuesday upset feels special because it is the only thing that happened on Tuesday. The rate is Saturday’s rate; the spotlight is the whole story.
Where this can mislead you
- One season. Every number here is 2024. The day-of-week differences that survive multiple seasons will be the real ones; Tuesday’s closeness and Thursday’s ugliness are each one modest sample, and Wednesday (n = 14) is barely a sample at all. The SEs are on the chart for exactly this reason.
- Days are team-mix effects, not causal effects. Schedulers decide who plays weeknights, and it shows: weekday Tuesday/Wednesday teams averaged a negative season margin. Nothing here says moving a game to Tuesday makes it close — it says the teams sent to play on Tuesday played close games. The one-score luck piece explains why close-game rates regress anyway.
- “Better team” is retrospective. Season margin excluding the game uses information nobody had on game night. It is a consistency yardstick across buckets, not a betting model.
- Days are Eastern-clock days. A late West Coast kickoff stays on its Eastern day in this data, but a different clock would shuffle a handful of games at the margins.
- The FBS proxy is the house one — 8+ cached appearances — and the binomial SEs treat games as independent, which midweek conference schedules only approximately are.
The takeaway
Tuesday is a rock-fight boutique: 19 games, no shootouts, half one-score. Thursday is where lopsided inventory goes — mostly opening-night FCS games in a Thursday costume, though the real FBS slate was still the week’s most lopsided. Friday was the closest thing 2024 had to a premium night, and nobody marketed it that way. And the aggregate weeknight game is a Saturday game with fewer witnesses — same upset rate, same home edge to the decimal, same margins. The next time a MACtion upset trends, the correct reading is not that weeknights are cursed. It is that on Saturday, that exact game happens three times and you never hear about any of them.
Reproduce it
The chart above is rebuilt from the cache on every charts build by charts/chart_weeknight.py, which mirrors the letdown audit’s loader but keeps full kickoff timestamps, converts them to Eastern time, and recomputes every number in this article — the census, the UTC-shift count, the overtime-census cross-check, the per-night rates and SEs, the Thursday dissection, the better-team and home-team win rates, and the named games — warning at build time if the cache stops reproducing any of them. The core:
et = utc_kick - (4h before Nov 3, else 5h)   # 205 of 877 games change days
tue = ff_games("Tue")   # n=19:  52.6% one-score, median margin 7
thu = ff_games("Thu")   # n=20:  60.0% blowouts, median margin 24
fri = ff_games("Fri")   # n=58:  48.3% one-score vs Saturday's 38.0%
better_team_wins: Sat 70.5% (452/641) vs weekday 72.1% (80/111)
Sources & further reading
- Data: my locally cached ESPN public-API scoreboard responses (
scripts/cache/, retrieved June 2026; provenance indata_layer/SOURCE.txt) — 877 completed 2024 games through December 21, with finals, venues, and full kickoff timestamps. - Every figure above is recomputed from that cache at build time by
charts/chart_weeknight.py, which converts each kickoff from UTC to Eastern time before assigning a day, reproduces the overtime census’s published Saturday/Friday/Tuesday overtime split as an external check, and warns if any published number drifts. - Related: the letdown and the bounce-back (the loader this piece mirrors), the margin census (the one-score and blowout lines), how often the better offense wins (the better-team yardstick), home-field advantage, measured, one-score records and luck, and opening week, measured (where the Sunday game, the Monday game, and 19 of Thursday’s FCS visits all live).