Three times in 2024, Louisiana Tech finished sixty minutes of football tied. Three times the game went to overtime, and three times the Bulldogs lost — 23–20 to Tulsa, 33–30 at New Mexico State in double overtime, 44–37 to Jacksonville State. They finished the cached season 5–7 (every record in this piece is a cache record — through December 21, bowls excluded). Flip those three coin-toss games and the same season’s arithmetic reads 8–4. That is the overtime problem in one schedule: the sport’s loudest tiebreaker is also one of its rarest and least predictable events. Across the 877 completed 2024 games in this site’s cache, exactly 35 went to overtime — 4.0%, one game in 25 — and this article is the census of all of them: the rate barely moves whichever way you slice the season, the games that get there are statistically ordinary right up to 0:00, and the teams they happen to are not a special breed of close-game merchants. Overtime, in the data, behaves like weather. Which is exactly why its verdicts — a 5–7 in Ruston, an SEC title in Atlanta — deserve less narrative weight than they get.
What counts as an overtime game here
Same dataset as the margin-distribution piece: my locally cached ESPN scoreboard responses, 877 completed 2024 college football games, August 24 through December 21 kickoffs (retrieved June 2026) — the regular season, the conference championships, Army–Navy, and three of the four CFP first-round games. The quarterfinals onward and the January bowls are not in the cache, so nothing here speaks to them. A game counts as overtime when the feed’s final status shows more than four periods played; every one of the 35 also carries a “Final/OT”-style label, and the two signals agree perfectly. The feed’s per-quarter linescores let me reconstruct every game’s score through three quarters and through regulation, and two audits pass before anything below gets published: the period scores sum to the final in all 877 games, and all 35 overtime games were exactly tied after the fourth quarter, as they’d better be. Bookkeeping conventions, same as always: month groupings use the feed’s UTC date stamps; where I name a real-world date I’ve converted the cached kickoff to U.S. Eastern.
The census: 35 games, 54 extra periods
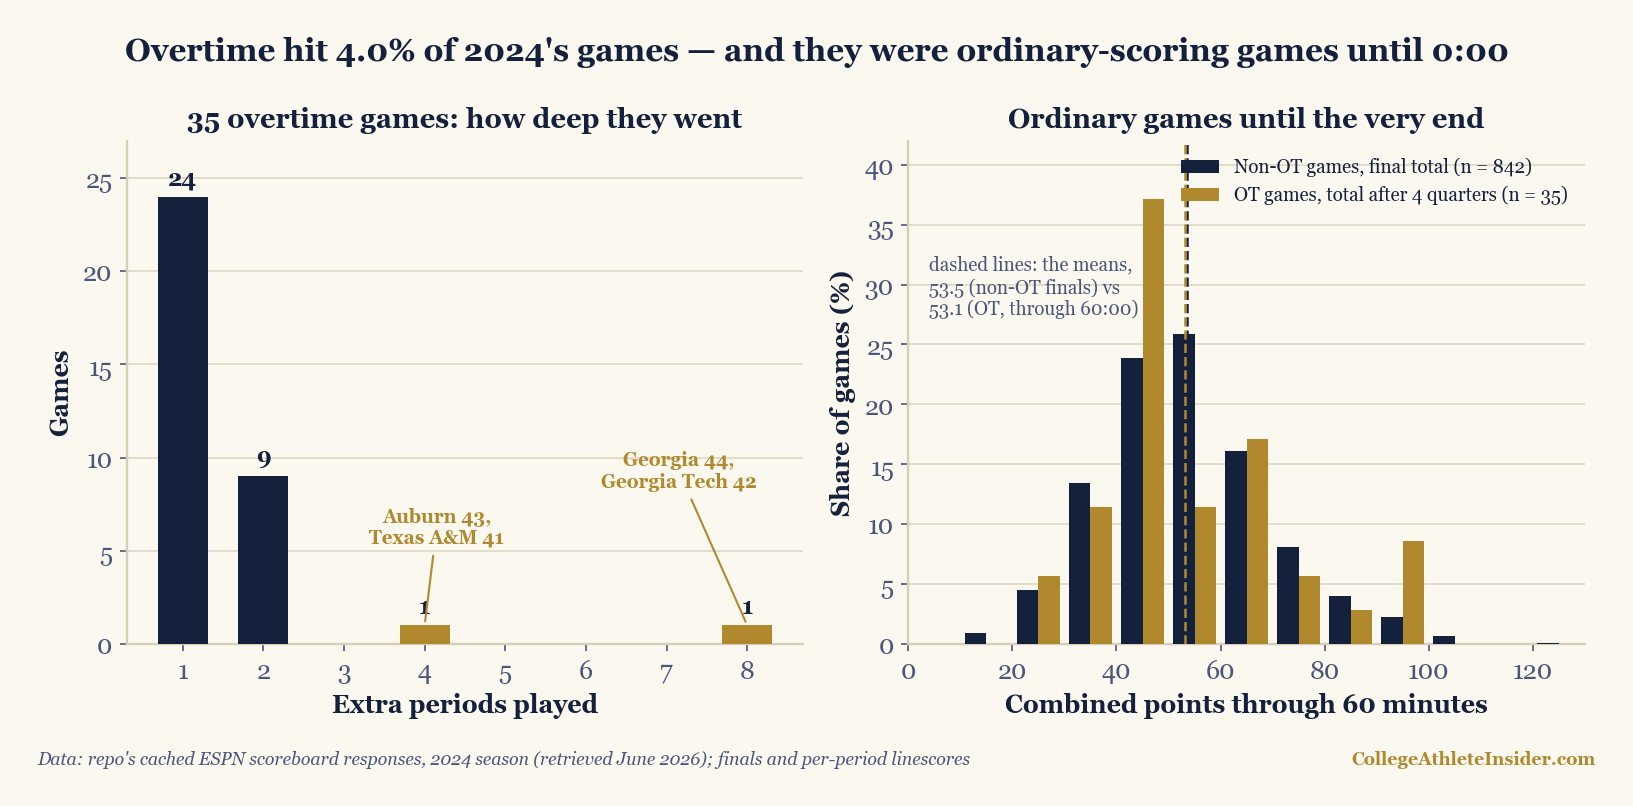
The depth distribution is steep. 24 of the 35 (68.6%) ended in the first extra period; 33 of 35 (94.3%) were done within two. Nobody stopped at three. Then two famous outliers: Auburn outlasted Texas A&M 43–41 in four overtimes on November 23, and Georgia survived Georgia Tech 44–42 in eight on the Friday after Thanksgiving (November 29 — the feed stamps it November 30 UTC). All told the season played 54 extra periods. Set against the margin distribution: the 35 overtime games are 11.4% of 2024’s 306 one-score games — every overtime final is one-score by construction — and their margins cluster hard on the field goal: 13 of 35 ended by exactly 3, seven by 7, and none by 4 or 5. That last gap is worth a sentence of interpretation, clearly labeled as such: a 4- or 5-point overtime final is perfectly legal, but it generally requires a team that trails by a touchdown to kick a field goal that still loses. Facing fourth down and a deficit, teams go for it — so the “pointless field goal” margins simply never occurred.
A flat 4%, almost everywhere you cut
| Month | Games | Overtime games | Rate |
|---|---|---|---|
| August | 85 | 2 | 2.4% |
| September | 275 | 11 | 4.0% |
| October | 223 | 9 | 4.0% |
| November | 268 | 11 | 4.1% |
| December | 26 | 2 | 7.7% |
September 4.0%, October 4.0%, November 4.1%. I went looking for a “conference play tightens everything” arc like the one the margin piece found for one-score rates, and it is not here: the tie rate is a metronome. The two deviations both make sense and both sit on tiny counts. August’s 2.4% is the cupcake month again — the slate that produces 48% blowouts produces almost no 60th-minute ties. December’s 7.7% is 2 games out of 26, one of which is really a November 30 kickoff wearing a UTC stamp; by Eastern reckoning, December’s only overtime game was the SEC Championship itself. The slice comparisons tell the same flat story: conference games 21 of 528 (4.0%), non-conference 14 of 349 (4.0%) — identical. Split the non-conference slate the way the margin piece did and a real gap finally appears: FBS-vs-FBS non-conference games went to overtime 12 times in 227 (5.3%), while the 122 games with an FCS-side visitor produced just 2 (1.6%). Mismatches don’t tie. Both exceptions are worth naming: Texas Tech needed overtime to escape Abilene Christian 52–51 on opening Saturday after the Wildcats hung 17 fourth-quarter points to force it — and Southern Utah walked into the Sun Bowl on September 7 and beat UTEP 27–24 in overtime, the cache’s one FCS-over-FBS extra-time win. Games involving a ranked team ran 4.8% (13 of 270). The lottery does not check credentials.
Where the rate looks uneven, the counts are too small to trust, and I’d rather show you that than smooth it. Among flagged conference games, Conference USA hit overtime 5 times in 40 games (12.5%) — Louisiana Tech alone was in two of those five, plus a non-conference overtime for a league-leading three total — while the SEC and MAC each ran 6.2%, the Big Ten 4.9%, and the Mountain West went 0 for 42. Five-versus-zero across 40-game samples is noise until multiple seasons say otherwise. Two calendar quirks are real enough to enjoy, though: every one of the 35 landed on a Saturday (26), Friday (5), or Tuesday (4) Eastern — and all four Tuesday entries were midweek MAC and Conference USA games, which is the most on-brand statistic MACtion has ever produced. The season’s densest stretch was the weekend of September 20–21, with six overtime games; October 12 — the Saturday the margin piece crowned the year’s tightest — added four in one day, including Penn State’s 33–30 escape at USC and Illinois 50, Purdue 49.
The hour before overtime looks like any other game
Overtime games must end close; that’s definitional. The open question is what they look like before the tie, and the linescores give a clean answer: ordinary. The 35 overtime games produced a combined 53.1 points through four quarters on average (median 48) — the other 842 games averaged 53.5 at the final gun (median 52). The distributions sit on top of each other in the chart above. The range runs from Duke 13, Northwestern 13 — a Friday-night rock fight that Duke eventually won 26–20 in two overtimes — up to Washington State 46, San José State 46, a 92-point regulation that became the season’s highest-scoring overtime game at 106. Overtime is not where defensive struggles go, and it is not where shootouts go. It is where any kind of game goes when the last score happens to land level.
The route to the tie is livelier than the totals. Only 9 of the 35 were tied after three quarters; in the other 26 somebody led, and five teams entered the fourth quarter down more than one score and still forced the extra period. Fourth quarters that end tied are busy fourth quarters: overtime games averaged 17.3 combined fourth-quarter points against 13.8 everywhere else. And if you’re tempted by momentum stories — surely the team that stormed back owns the extra period? — the ledger says the 26 third-quarter leaders went 14–12 once overtime started. A coin, again. Two comebacks deserve their worked example. In Pullman on September 20, San José State led Washington State 38–24 after three; the Cougars won the fourth quarter 22–8 to reach 46–46, both teams blanked the first overtime, and WSU took the second 8–6 — 54–52. And in the SEC Championship on December 7 (the season’s only neutral-site overtime), Georgia led Texas 13–6 after three, Texas won the fourth 10–3 to force 16–16, and in the extra period Texas managed a field goal, Georgia a touchdown: 22–19, No. 5 over No. 2 by the feed’s own rankings.
The marathons, decoded from the box score
The cache has no play-by-play, so a quick paragraph of rulebook history, clearly labeled as public record rather than cache output: FBS overtime arrived in 1996 as matched possessions from the opponent’s 25; a 2019 change sent games to alternating two-point plays from the fifth overtime; and since 2021 the compression is harsher still — a touchdown in the second overtime must be followed by a two-point try, and from the third overtime on, teams simply alternate single two-point attempts. What the cache does hold is the per-period linescores, and they carry the format’s fingerprints exactly where the rulebook says they should be:
| Team | Reg. | OT1 | OT2 | OT3 | OT4 | OT5 | OT6 | OT7 | OT8 | Final |
|---|---|---|---|---|---|---|---|---|---|---|
| Texas A&M (Nov 23) | 31 | 7 | 3 | 0 | 0 | — | — | — | — | 41 |
| Auburn | 31 | 7 | 3 | 0 | 2 | — | — | — | — | 43 |
| Georgia Tech (Nov 29) | 27 | 7 | 6 | 0 | 0 | 2 | 0 | 0 | 0 | 42 |
| Georgia | 27 | 7 | 6 | 0 | 0 | 2 | 0 | 0 | 2 | 44 |
Read the Georgia–Georgia Tech rows like a decoder ring. The 7–7 first overtime is two touchdowns with kicked extra points. The 6–6 second overtime is the 2021 rule in the wild: two touchdowns, two mandatory two-point tries, both failed. Then six rounds of the shootout — 0–0, 0–0, 2–2, 0–0, 0–0 — until Georgia converted in the eighth and Georgia Tech didn’t. Twelve alternating two-point attempts decided a game that Georgia Tech had led 17–6 after three quarters, before Georgia’s 21-point fourth forced the tie at 27. Auburn–Texas A&M is the same grammar in miniature: touchdowns, then field goals, then a scoreless shootout round, then Auburn’s lone conversion. If you want the expected-value math on when a two-point try is the right call in the first place, the two-point conversion piece runs it; what the marathon box scores show is the format deliberately shrinking the game until a single such play is all that’s left. One honest caveat belongs here: the linescores are consistent with that reading, but the cache holds no play-level detail — it cannot show who possessed first, what the failed tries looked like, or anything about eras before 2024.
Do overtime teams look different? No — and that’s the finding
Fifty-four different programs played in those 35 games, and I expected the roster to skew toward a type — mediocre teams in tight leagues, maybe, or the chronically dramatic. The cache declines the narrative. Among teams with at least 12 cached games, the 51 overtime participants averaged a .545 season win percentage against .529 for all 132 such teams, with essentially identical spread. The participant list runs the full table, from 1–11 Purdue (0–2 in overtime) to 12–2 Texas and 12–2 Penn State. Even the “close-game team” hypothesis fails: in their other 465 games, overtime participants finished one-score 30.5% of the time — slightly below the league’s 34.9%. Playing overtime in 2024 marked a team the way being rained on marks you: it says you were outside, not that you attract clouds.
What overtime lacks in selectivity it repays in consequence, because the repeat customers’ seasons swung on it. Louisiana Tech’s 0–3 you know. Massachusetts and Kennesaw State both went 0–2 inside 2–10 seasons; Virginia Tech went 0–2 and finished 6–6; Vanderbilt’s overtime win over those same Hokies on opening weekend was one of exactly six wins in its 6–6. On the other side of the flips: Buffalo (8–4), Liberty (8–3), Syracuse and Illinois (both 9–3) all went 2–0, and Illinois’s pair — at Nebraska, then 50–49 over Purdue — supplied two of the nine wins in its cached season. And Georgia went 2–0 with the season’s two heaviest overtime games: the eight-period rivalry escape and the SEC title. Whether you read those ledgers as clutch or as coin flips is precisely the argument the close-game luck piece settles with year-over-year data — records in games this tight regress hard, which is the kindest possible framing for Ruston and the most deflating one for anyone crowning an “overtime team.”
Who wins overtime — and what this cache can’t tell you
Home teams went 21–13 (61.8%) in the 34 non-neutral overtime games, against a 64.4% raw home win rate across all non-neutral games in the cache. Before anyone reads meaning into the difference: the raw baseline is inflated by every scheduled mismatch (the home-field piece spent its whole length shrinking +8.8 raw points to about +3 of true advantage), and 34 games decide nothing to a tenth of a point anyway. The more interesting known edge in overtime isn’t venue at all — it’s possession order. The overtime-math piece models the team choosing to go second at roughly a 56–44 advantage, because it plays every down knowing exactly what it needs. I would love to verify that against 2024’s 35 games. This cache cannot do it: scoreboard linescores record points per period, not who possessed first. That test needs play-by-play data, and an honest census says so rather than proxying it badly.
Where this can mislead you
- Thirty-five is a small sample. The flat 4.0% is the season’s true observed rate, but every subdivision of 35 — by conference, by month, by weekday — rides counts of 0 to 5. Conference USA’s 12.5% versus the Mountain West’s 0.0% is five games versus zero. Enjoy it; don’t model on it.
- One season, one window. The cache ends December 21: no Notre Dame–Indiana first-round game, no quarterfinals onward, no January bowls. A different season — or the missing postseason — could move a number built on 35 events a long way.
- Dates are UTC stamps unless converted. Month rows use the feed’s stamps; named dates in the prose are Eastern conversions. That’s why “December” has two overtime games but Eastern December had one.
- The rules history is rulebook record, not cache output. The 1996 origin, the 2019 fifth-overtime change, and the 2021 second/third-overtime compressions are public record. The cache corroborates the shape (those 0-and-2 linescore rows) and nothing deeper — no possession order, no play detail, no earlier eras.
- “FCS side” is a proxy — a team appearing fewer than six times in the cache, same convention as the margin piece. For 2024 it cleanly separates the 134 FBS regulars from the guarantee-game visitors.
- Overtime rate is not a team skill. Nothing here supports scheduling, betting, or narrating around a team’s “overtime tendency”: participants’ seasons were ordinary, their other games weren’t unusually close, and overtime W–L is the fastest-regressing split in the sport.
- The missing margins are incentives, not law. No 2024 overtime game ended by 4 or 5 points, and I read that as rational fourth-down behavior — but it’s a reading. The rulebook permits those finals; 2024’s teams simply never kicked the field goal that loses.
The takeaway
College football overtime in 2024 was a flat 4.0% lottery that checked no credentials: identical rates in and out of conference play, level across the season’s months, indifferent to rankings, avoiding only the mismatches that can’t stay tied. The games it caught were ordinary — 53.1 combined points through sixty minutes against 53.5 everywhere else — until busy fourth quarters (17.3 points against 13.8) delivered them level, two-thirds ended one period later, usually by a field goal, and the teams involved were not a type. But the sport keeps score in wins, not process, so a mechanism this arbitrary still wrote 2024’s margins of history: it handed Georgia a rivalry escape and an SEC championship by a combined five points across nine extra periods, built a quarter of Illinois’s nine-win case, and billed Louisiana Tech three losses by a combined thirteen. The overtime format’s one known, persistent edge — going second — is assigned by a coin toss. It is the rare corner of the sport where the honest analytical position and the fan’s superstition converge completely: once it’s tied at 0:00, nobody knows anything.
Reproduce it
Detection is one comparison; the audit is two sums. The chart above is rebuilt from the cache on every charts build by charts/chart_overtime_census.py, which recomputes every number in this article — the census, the month and slice rates, the regulation totals, the marathon linescores, the participant win percentages — and warns if the cache stops reproducing any of them. The core:
ot = [g for g in games if g["status_period"] > 4]          # 35 of 877 (4.0%)
Counter(g["status_period"] - 4 for g in ot)                # {1: 24, 2: 9, 4: 1, 8: 1}
reg = lambda c: sum(p["value"] for p in c["linescores"] if p["period"] <= 4)
all(reg(g.home) == reg(g.away) for g in ot)                # True — tied at 0:00
mean(reg(g.home) + reg(g.away) for g in ot)                # 53.1 pts through 60 min
mean(g.total for g in games if not g.ot)                   # 53.5 — same game
Run python charts/chart_overtime_census.py and it prints the full audit — census, slices, linescore checks — before it draws a bar.
Sources & further reading
- Theory: Chapter 21: Win Probability Models — a free chapter at DataField.dev; overtime is the boundary case where pregame win probability collapses to a sequence of short-field possessions.
- Data: my locally cached ESPN public-API scoreboard responses (
scripts/cache/, retrieved June 2026; provenance indata_layer/SOURCE.txt) — 877 completed 2024 games through December 21, finals and per-period linescores. - Every figure above is recomputed from that cache at build time by
charts/chart_overtime_census.py, which warns if any published number drifts. - Overtime format history (1996 introduction; 2019 and 2021 changes): NCAA playing rules, public record — labeled as such above wherever it appears.
- Related: how the overtime format’s math works (the 56–44 second-possession edge this cache can’t test), the full margin distribution (where the 35 sit among 306 one-score games), and one-score records and luck (why overtime W–L regresses).