Ask a sportsbook what home field is worth in college football and you get a shrug and a number: two and a half, maybe three points. Ask the raw results of the 2024 season and you get a very different answer: the home team won 64% of the time by an average of almost nine points. Both numbers are real. Only one of them is home-field advantage. This piece measures the gap between them from this site’s own cached season of results, and shows — with a regression you can rerun — that once you hold team strength equal, the home edge lands almost exactly where the spread market has always put it: +3.0 points. The other six points are the schedule.
What I measured, exactly
The data is the same cached set of ESPN scoreboard responses that powers the Pythagorean and second-order-wins pieces: every completed 2024 FBS regular-season game in my cache — 873 games, kickoffs from August 24 through December 14, 2024, retrieved June 2026. (The cache also holds three of the four CFP first-round games and one FCS playoff semifinal; I exclude all postseason games here, since bowl and playoff “home” designations are mostly bracket bookkeeping.) Each game record carries both scores, a home/away flag, and — usefully — ESPN’s neutralSite marker, so neutral-site kickoffs and rivalry games can actually be excluded rather than hand-waved. Twenty of the 873 games are flagged neutral; that leaves 853 true home games.
The raw measurement takes one line: the home team won 548 of 853 games (64.2%) by an average margin of +8.82 points. My earlier home-field tutorial reported 63.8% and +8.6 on all 873 games; stripping the 20 neutral dates nudges the numbers up a hair and changes nothing about the story. And the story is that both versions of the raw number are wildly inflated. Nobody who sets real spreads believes home field is worth nearly nine points, and they are right not to.
Follow the nine points
The inflation has a name: scheduling. Home teams are not randomly chosen — in September, they are overwhelmingly the better team, because power-conference programs pay six- and seven-figure guarantees to host opponents they expect to beat. The cache lets me split the season along exactly that fault line, using ESPN’s conference-game flag plus a simple visitor test: a visiting team that appears in fewer than six cached FBS games is, almost by definition, an FCS opponent making a paid appearance (FBS teams show up twelve or thirteen times).
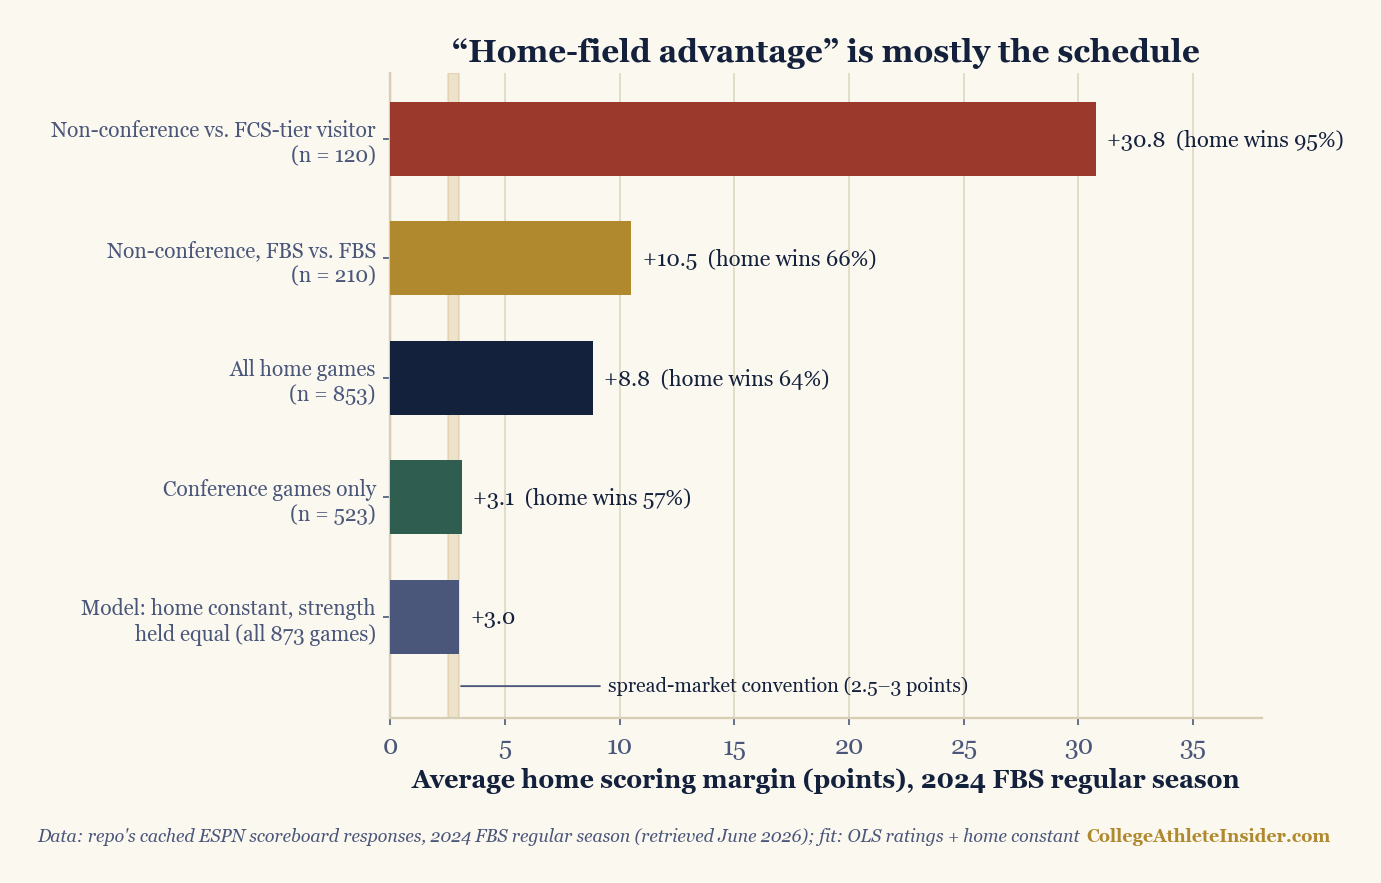
| Slice | Games | Home win% | Avg. home margin |
|---|---|---|---|
| Non-conference, FCS-tier visitor | 120 | 95.0% | +30.8 |
| Non-conference, FBS vs. FBS | 210 | 65.7% | +10.5 |
| All home games | 853 | 64.2% | +8.8 |
| Conference games only | 523 | 56.6% | +3.1 |
Read it top to bottom and the raw number falls apart in your hands. In the 120 buy games against FCS-tier visitors, the home team went 114–6 and won by 31 points a game — that is not a crowd effect, that is Ohio State hosting a team two divisions down. Even FBS-vs-FBS non-conference games run +10.5, because those slates are stacked with mid-major road trips to power-conference stadiums. Conference play is the closest thing the sport offers to a natural experiment: round-robin-ish schedules where home and road assignments alternate by contract rather than by who paid whom, so the home team is, on average, no better than its guest. There, the home side won 296 of 523 (56.6%) by +3.10 — and 56.6% is no fluke of a small sample, sitting three standard errors above a coin flip (the 50% null carries a ±2.2-point standard error at n = 523).
Holding strength equal: the regression
Splitting by schedule is a blunt control. The clean one — the one my tutorial promised but left as an exercise — is to fit team quality and home field at the same time. So: give each of the 230 teams in the cache a rating, and model every game as
margin = rating(home) − rating(away) + H
with H added only when the game is not at a neutral site. Ordinary least squares over all 873 games then chooses the ratings and H together, so H is the average number of points the venue is worth after the rating gap between the two teams has been paid out. The answer: H = +2.99 points. Refit it on conference games alone and you get +2.91; drop every game involving a team with fewer than six cached appearances and you get +2.99 again. However I slice it, the fitted home constant refuses to leave the neighborhood of three — which is precisely the 2.5-to-3-point convention the betting market settled on decades ago, and the +65 Elo bump (≈2–3 points) my Elo tutorial bakes in.
The consistency check
The site’s spread-to-win-probability model converts a margin into a win chance with one expression, Φ(spread / σ) with σ = 16 for FBS. That gives me a way to audit this article against itself: the model and the measurement had better agree. Feed it the fitted home edge and it says a home team facing an equal opponent — effectively a 3-point favorite — should win Φ(2.99 / 16) = 57.4% of the time. The quality-balanced slice I actually measured, conference play, came in at 56.6%. Two independent routes — a normal-curve model with an assumed σ, and a raw count of 523 real games — land within a point of each other. That agreement is the closest thing this kind of work gets to a reproducibility test, and it passed.
One trap worth flagging, because it looks like a failure and isn’t: plug the overall average margin into the same formula and you get Φ(8.82 / 16) = 70.9%, well above the measured 64.2%. The formula isn’t broken — it’s being misused. Φ is a curve, and the average of a curve is not the curve of the average: a season that mixes +31 buy games (where the extra 20 points buy almost no extra win probability, since 95% is nearly the ceiling) with +3 conference games can average +8.8 in points while averaging far less than Φ(8.8/16) in wins. Do it properly — run every game’s fitted margin through Φ(·/16) and average the probabilities — and the model predicts 63.1% home wins against the measured 64.2%. Consistent again, once the curve is respected.
Where this can mislead you
- It’s one season. 873 games is a real sample, but a single year can’t say whether 2024’s home edge was typical, and the cache ends at the regular season — I make no claim about bowls.
- The FCS test is a proxy. “Visitor with fewer than six cached games” catches paid FCS visits cleanly, but it is an inference from the cache’s shape, not a division label in the data.
- Conference home slates aren’t perfectly random. Alternating home-and-home contracts make them close to it in expectation, but any one year’s rotation can hand some teams a softer home draw. The regression is the stronger control, which is why I lead with it.
- The ranked-vs-ranked slice is too thin to lean on. Only 34 non-neutral ranked matchups exist in the cache (home side 23–11, +6.2); at that sample size the error bars swallow the estimate, so I report it and refuse to interpret it.
- One number hides real variance between venues. Altitude, crowd size, and travel distance almost certainly make some home fields worth more than others; a single H is the league average, not a deed to any particular stadium.
- The fit is in-sample. With six to thirteen games per team, the ratings absorb some noise, so treat +2.99 as a well-behaved estimate with soft edges, not a constant of nature.
The takeaway
Home-field advantage in college football is real, and it is small: about a field goal. The nine-point version you can compute in one line is a true fact about the sport’s scheduling economy and a false fact about venues. When a number surprises you, the first question is not “is it right?” but “what else is it measuring?” — here, six of the nine points were measuring who pays whom to visit. If you want to feel the three points move a win probability yourself, the spread and rating tools on the calculators page run the same Φ(spread/16) conversion live.
Sources & further reading
- Related chapter: Chapter 18: Game Outcome Prediction, DataField.dev.
- Data: my locally cached ESPN public-API scoreboard responses (
scripts/cache/, retrieved June 2026; provenance indata_layer/SOURCE.txt) — 873 completed 2024 FBS regular-season games, of which 20 are flagged neutral-site. - Every figure above — the slice table, the fitted H = +2.99, and the chart — is recomputed from that cache by
charts/chart_home_field_funnel.py, which warns at build time if the numbers stop reproducing. - The Φ(spread / σ) conversion follows the normal-margin model in Wayne Winston’s Mathletics, as used in the spread-to-win-probability piece (σ = 16 for FBS).
- Related: the measurement tutorial this piece finishes, Elo with a home-field term, and the transitivity trap — more schedule effects wearing a stat’s clothing.