Ask a college football fan what share of games come down to one score and you’ll usually get a shrug and something about “any given Saturday.” I can’t cite a survey of those guesses — nobody polled the couch, and I don’t invent numbers — so run the experiment on yourself before reading on: of all the 2024 games, what fraction stayed within eight points? What fraction ended as a 25-point-plus rout? Here is what the site’s cached season actually says, across 877 completed games: just over a third — 306 games, 34.9% — finished within one score, and nearly as many — 256 games, 29.2% — were decided by 25 or more. The median college football game of 2024 was decided by 15 points. Nearly half the season — 417 games, 47.5% — ended three scores or worse. College football’s reputation runs on its photo finishes, but by the accounting, it is a blowout league — and about a third of that blowout share turns out to be the schedule’s doing, not the sport’s.
What I measured, exactly
The data is the same bundled cache behind the better-offense piece and the home-field piece: ESPN scoreboard responses covering 877 completed 2024 college football games, August 24 through December 21 kickoffs (as retrieved June 2026). That window is the regular season, the conference championships, Army–Navy, and three of the four CFP first-round games — the December 20 Notre Dame–Indiana game is not in the cache, and neither are the quarterfinals onward or the January bowls, so nothing here speaks to them. “Margin” means the final score’s absolute difference, nothing fancier, banded the way fans already think: 1–8 (a one-score game), 9–16, 17–24, and 25+. No game in the cache ended tied; 35 of the 877 (4.0%) needed overtime, and every one of those lands in the one-score band by construction. One bookkeeping convention up front: any date-grouped count below follows the feed’s own game-date stamps, which run on UTC — a late Saturday-night kickoff carries the next day’s stamp. Where I name a specific game’s real-world date (Indiana’s November 30 finale, say, which the feed stamps December 1), I’ve converted the cached kickoff time to U.S. Eastern.
The distribution, banded
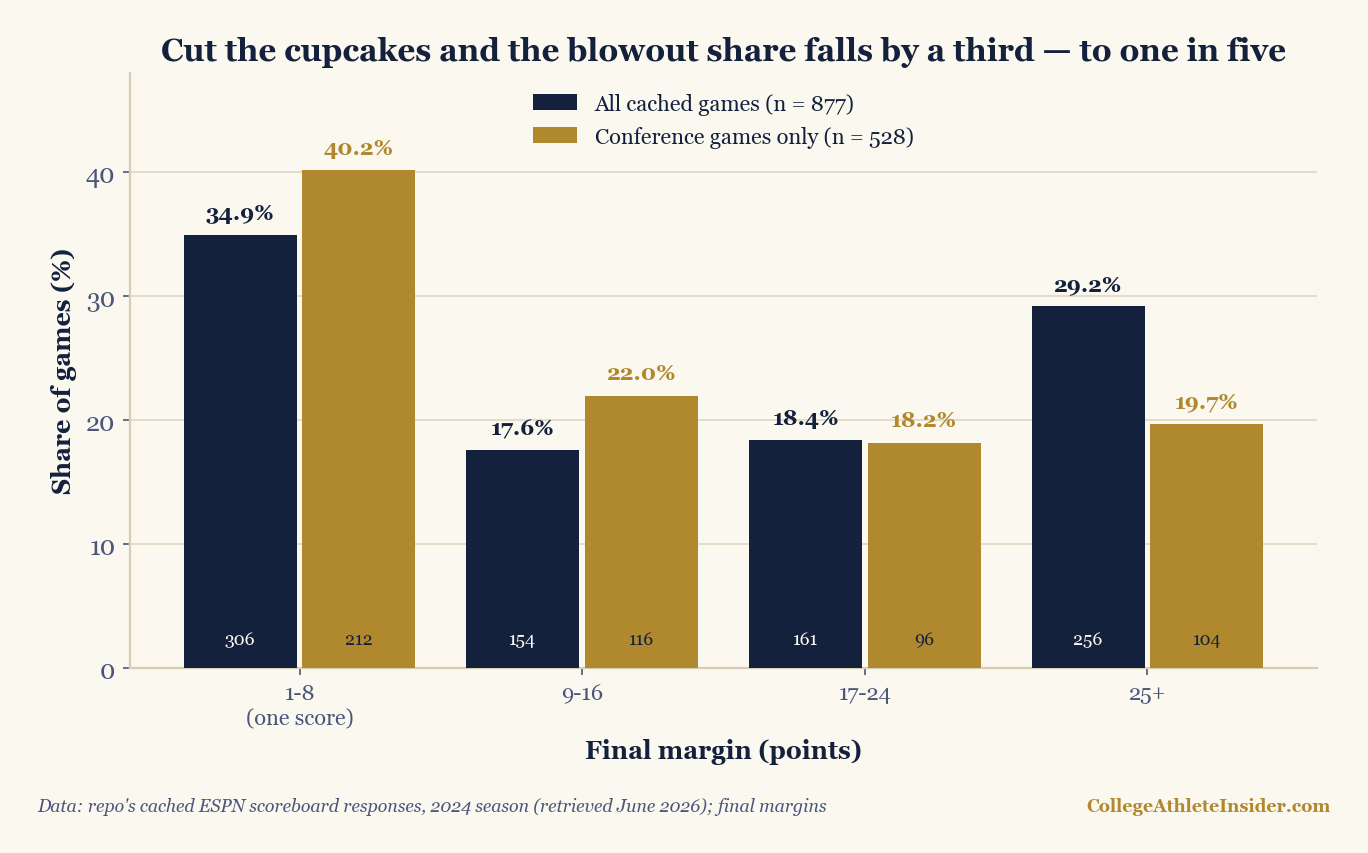
| Slice | Games | 1–8 | 9–16 | 17–24 | 25+ | Median margin |
|---|---|---|---|---|---|---|
| All cached games | 877 | 34.9% | 17.6% | 18.4% | 29.2% | 15 |
| Conference games | 528 | 40.2% | 22.0% | 18.2% | 19.7% | 11 |
| Non-conference, FBS vs FBS | 227 | 33.5% | 12.3% | 19.8% | 34.4% | 18 |
| Games with an FCS side | 122 | 14.8% | 8.2% | 16.4% | 60.7% | 31 |
Two details in the all-games row deserve their own sentence. First, the shape is not a bell curve sagging toward zero — it is nearly a U. The two fattest bands are the extremes: one-score games (34.9%) and 25-plus blowouts (29.2%), with the middle margins underrepresented. Football’s scoring quantum shows up in the fine grain too: the two most common exact margins in the entire season were 3 points (69 games) and 7 points (68 games) — a field goal and a touchdown deciding 137 games, 15.6% of the season, all by themselves. And second, the far tail is heavier than the near one: 2024 produced 86 games decided by 40 or more points (31 of them by 50-plus) against just 30 games decided by exactly one. The season manufactured nearly three 40-point demolitions for every one-point thriller.
Two Saturdays, one league
The distribution isn’t spread evenly across the calendar; it’s front-loaded to a degree that’s almost comic. Take the 56 games the cache stamps August 31, the season’s opening Saturday: 25 of them — 44.6% — decided by 25 or more, and only 9 (16.1%) within one score. That was the day Ole Miss beat Furman 76–0, Auburn beat Alabama A&M 73–3, and Tennessee beat Chattanooga 69–3. (The season’s single widest margin came twelve days later on a Thursday night, when South Alabama beat Northwestern State 87–10 — 77 points, a record nobody advertises.) Now slide six weeks forward to the 41 games stamped October 12: 8 blowouts (19.5%) against 21 one-score finishes — 51.2% of the slate, including Illinois surviving Purdue 50–49. Same league, same rules, same teams. The only thing that changed is who was allowed to play whom.
| Month | Games | One-score (1–8) | Decided by 25+ |
|---|---|---|---|
| August | 85 | 15 (17.6%) | 41 (48.2%) |
| September | 275 | 88 (32.0%) | 98 (35.6%) |
| October | 223 | 90 (40.4%) | 47 (21.1%) |
| November | 268 | 106 (39.6%) | 62 (23.1%) |
| December | 26 | 7 (26.9%) | 8 (30.8%) |
In August, half the league’s games were routs. By October the rout rate had fallen by more than half and the one-score rate had more than doubled. This is the same September confound the better-offense piece found inflating early-season scoring averages, seen from the other side of the scoreboard: the opening month is not a sample of college football, it’s a sample of college football’s bookings.
The cupcake correction
So make the honest cut. The cache contains 122 games in which one side appears fewer than six times in the whole dataset — the FCS guarantee visitors (96 such programs passed through, against the 134 regulars of the FBS), plus one cached FCS playoff semifinal that rode along in the feed (North Dakota State 28, South Dakota State 21, December 21). Those games were decided by 25-plus points 60.7% of the time, with a median margin of 31. They are a fifth-ranked band of the schedule whose entire statistical purpose is to be lopsided. Drop them and you’re left with FBS-vs-FBS non-conference games — still 34.4% blowouts, because September’s paid mismatches between FBS tiers live here — and finally the 528 regular-season conference games, the closest thing the sport has to a fair fight: 40.2% one-score, 19.7% decided by 25+, median margin 11.
That is the article’s honest headline, stated both ways. Cutting every cupcake and every scheduled mismatch shrinks the blowout share by about a third, from 29.2% to 19.7% — the “blowout league” is substantially a scheduling artifact. And yet: even inside conference play, with rosters built from the same recruiting pool and stakes on every snap, one game in five still ends as a four-score rout, and the rout ceiling stays high — Indiana closed its regular season by winning a conference rivalry game, the Old Oaken Bucket, 66–0 over Purdue on November 30, and Colorado shut out Oklahoma State 52–0 the day after Thanksgiving. One bookkeeping note so the buckets are reproducible: the feed does not flag conference championship games as conference competition — the SEC title game (Georgia 22, Texas 19, December 7) sits in the non-conference FBS row above, along with the three cached CFP first-round games.
Power 4 vs. Group of 5: the split that isn’t there
My own guess before running this was that the blowout residue inside conference play belonged to the Group of 5 — thinner rosters, bigger internal gaps. The cache says no. Regular-season conference games in the four power leagues: 285 games, 41.4% one-score, 19.6% decided by 25+. In the Group of 5 leagues: 242 games, 38.4% one-score, 19.8% decided by 25+. The blowout rates are two-tenths of a point apart. Whatever produces a four-score conference game — a roster mismatch, a quarterback injury, a Saturday where everything breaks one way — it is distributed across the sport’s class system almost perfectly evenly.
| Conference | Games | One-score | Decided by 25+ |
|---|---|---|---|
| Big Ten | 81 | 31 (38.3%) | 21 (25.9%) |
| Big 12 | 72 | 31 (43.1%) | 14 (19.4%) |
| ACC | 68 | 34 (50.0%) | 11 (16.2%) |
| SEC | 64 | 22 (34.4%) | 10 (15.6%) |
| American | 56 | 15 (26.8%) | 19 (33.9%) |
| Sun Belt | 56 | 22 (39.3%) | 10 (17.9%) |
| MAC | 48 | 18 (37.5%) | 9 (18.8%) |
| Mountain West | 42 | 20 (47.6%) | 4 (9.5%) |
| Conference USA | 40 | 18 (45.0%) | 6 (15.0%) |
The interesting variance is league-by-league, not tier-by-tier — with the caveat, before anyone builds a narrative, that these are samples of 40 to 81 games and a single season, so the ordering should be held loosely. Still, the extremes are vivid: half of all ACC conference games finished within one score, the tightest league in the cache, while the American produced routs at 33.9% — the only conference whose blowout rate beat its one-score rate. The Mountain West was the sport’s pillow fight (47.6% one-score, 9.5% blowouts). And the Big Ten — home of the eventual national champion — had the highest blowout rate of the four power leagues at 25.9%, its median conference game decided by 15 points. A league can be elite and lopsided at once; 2024’s Big Ten was both.
One roster, the whole distribution
If you want the distribution compressed into a single schedule, take Purdue’s 2024, every margin from the cache: a 49–0 opening win over Indiana State, then losses of 59 (Notre Dame), 17, 18, 46 (Wisconsin), 1 (that 50–49 Illinois game), 35 (Oregon), 6, 45 (Ohio State), 39 (Penn State), 7 — and the 66–0 finale in Bloomington. Seven of Purdue’s twelve games were decided by 35 or more points; three were one-score games. Almost nothing in between. That is the U-shape as lived experience: the same roster that pushed two Big Ten opponents to a final possession spent seven other Saturdays on the wrong end of a running clock. And when the margins do land in the middle, it isn’t necessarily drama — the median margin of 15 is exactly Georgia 30, Texas 15 in Austin on October 19, a No. 1-versus-top-five showdown that ended two scores and change apart. The typical game of 2024, by margin, was that: decided, not dramatic.
Where this can mislead you
- Final margin is not competitiveness. A 21-point final can be a garbage-time touchdown away from a 14-point game that was never close, or a tie game broken open in the last five minutes. Margin bands count the scoreboard at 0:00, nothing else; play-by-play work like filtering garbage time exists precisely because the final score edits the story.
- One season, measured once. 877 games is a real sample, but it is 2024 alone, from a cache that ends December 21 — three of the four CFP first-round games are in (they went 28, 14, and 25 points; two of three were routs), the Notre Dame–Indiana opener, the quarterfinals onward, and the January bowls are not. Bowl season would change the December row; it can’t change August’s.
- The bands are conventional, not optimized. Eight points is “one score” in the two-point-conversion era; 25+ is “four scores.” I cut there because that’s how fans talk, and I didn’t try alternatives first. The exact percentages would shift with the cut points; the U-shape and the composition story would not.
- “FCS side” is a proxy. I flag a game by whether a team appears fewer than six times in the cache. For 2024 this cleanly separates the 134-team FBS from everyone else, and it also (correctly) catches the one FCS playoff semifinal the feed carried. It is a property of this cache, not a general method.
- Conference labels come from the feed. Championship games aren’t flagged as conference competition, so they sit in the non-conference FBS row; the two-team Pac-12’s single conference game is excluded from the Power/Group split. Both choices are disclosed above and neither moves any number materially.
- No cross-league comparison is on offer. It’s tempting to hold this up against the NFL’s famously tight margins, but this cache contains no NFL games, so this article quotes no NFL number. The comparison everyone wants to make is exactly the kind of thing that deserves its own measured dataset.
- Blowout rate is not a verdict on the product. Whether a 29% rout rate is a bug (competitive imbalance) or a feature (76–0 is its own spectacle) is taste, not math. The data settles the rate; it has no opinion on whether you should like it.
The takeaway
College football in 2024 was a league of extremes wearing the costume of a league of thrillers: a third of games one-score, nearly a third four-score-plus, a median margin of 15, and almost three times as many 40-point finals as one-point finals. About a third of the blowout share is pure scheduling — August guarantee games run a 60.7% rout rate and a 31-point median, and the sport’s calendar bakes them in by design — but the honest recomputation refuses to flatter anyone: in conference play, stripped of every cupcake, one game in five still ends 25-plus, at identical rates in the power leagues and the Group of 5. When a big margin does mean something, it’s as evidence about strength, which is why margin feeds Pythagorean expectation so much better than win-loss records do — and why a gaudy record built the other way, on a pile of one-score escapes, is the thing to distrust, as the close-game-luck piece shows. The scoreboard’s most common gifts are a field goal and a touchdown; its most common lesson is a running clock.
Reproduce it
The computation is one subtraction and a histogram. The chart above is rebuilt from the cache on every charts build by charts/chart_margin_bands.py, which recomputes every number in this article — the band tables, the month arc, the conference rows, the Saturdays, Purdue — and warns if any of them stops reproducing; the core fits in a few lines:
margins = [abs(g["hs"] - g["as"]) for g in games]      # 877 completed 2024 games
bands = [(1, 8), (9, 16), (17, 24), (25, 999)]
for lo, hi in bands:
    n = sum(1 for m in margins if lo <= m <= hi)
    print(lo, hi, n, round(100.0 * n / len(margins), 1))
# -> 306 (34.9%) | 154 (17.6%) | 161 (18.4%) | 256 (29.2%)
conf = [g for g in games if g["conferenceCompetition"]] # 528 games
# same loop -> 212 (40.2%) | 116 (22.0%) | 96 (18.2%) | 104 (19.7%)
Run python charts/chart_margin_bands.py and it prints the full audit before it draws a bar.
Sources & further reading
- Theory: Chapter 18: Game Outcome Prediction — a free chapter at DataField.dev on modeling margins and outcomes properly, with opponent adjustment.
- Data: my locally cached ESPN public-API scoreboard responses (
scripts/cache/, retrieved June 2026; provenance indata_layer/SOURCE.txt) — 877 completed 2024 games, August 24 through December 21, including three of the four CFP first-round games. - Every figure above is recomputed from that cache at build time by
charts/chart_margin_bands.py, which warns if any published number drifts. - Related: how often the better offense wins (the same September confound, measured in points per game), home-field advantage, measured (the same cache, the same schedule bias), and one-score records and luck (what that 34.9% band does and doesn’t tell you about teams).