Sixty-eight FBS games were played on Saturday, September 5, 2026, and the line called the winner in sixty-three of them. That is the number everyone will quote, and it is the least interesting one on the sheet. Favorites went 63–5 straight up but only 45–23 against the spread, and they beat the number they were asked to cover by 4.9 points on average — a miss that is 2.5 standard errors from zero on one day’s sample. The market knew who. It was short on how much, and it was short in the same direction in every kind of game on the card. The other thing the day tells me is about the road: in the thirty games between two FBS teams, road underdogs went 0–26, and the only two visitors who won were the two who were favored to.
The set, stated exactly
data_layer/build_week1_2026_saturday.py walked ESPN’s public FBS scoreboard for UTC September 5 through 8, converted every kickoff to Eastern time, and kept the completed games whose Eastern date was Saturday the 5th: 68 games, every one of them final, 98 FBS teams in action, one neutral site (Baylor–Auburn) and one conference game (UNLV at Hawai’i). Thursday and Friday belong to the weeknight piece; the four games still to come this week — Washington State at Washington, Louisville–Ole Miss, Wisconsin–Notre Dame, and SMU at Florida State on Monday — are in the file as unplayed and are not counted anywhere below. The busiest hour was 7 p.m. Eastern with 18 kickoffs; noon had 13.
The new ingredient is the line. The scoreboard drops its odds once a game is final, but ESPN’s per-game summary endpoint keeps a single DraftKings entry — spread, total, both money lines — and the builder stored it verbatim. All 68 games carry a spread; 50 carry a money line, and the 18 without one are exactly the games where the favorite laid 37.5 or more. I treat the spread as the number ESPN served the morning after, not as a verified closing line; more on that in the limits.
For every game the residual is the home margin plus the spread: a host favored by 27.5 who wins by 1 has a residual of −26.5, which is exactly what Michigan produced against Western Michigan. Seen from the favorite’s side, positive means the favorite beat the number and negative means the underdog covered; no game landed on the number. Every figure below is recomputed from the JSON by charts/chart_week1_2026_saturday.py, which also draws the chart.
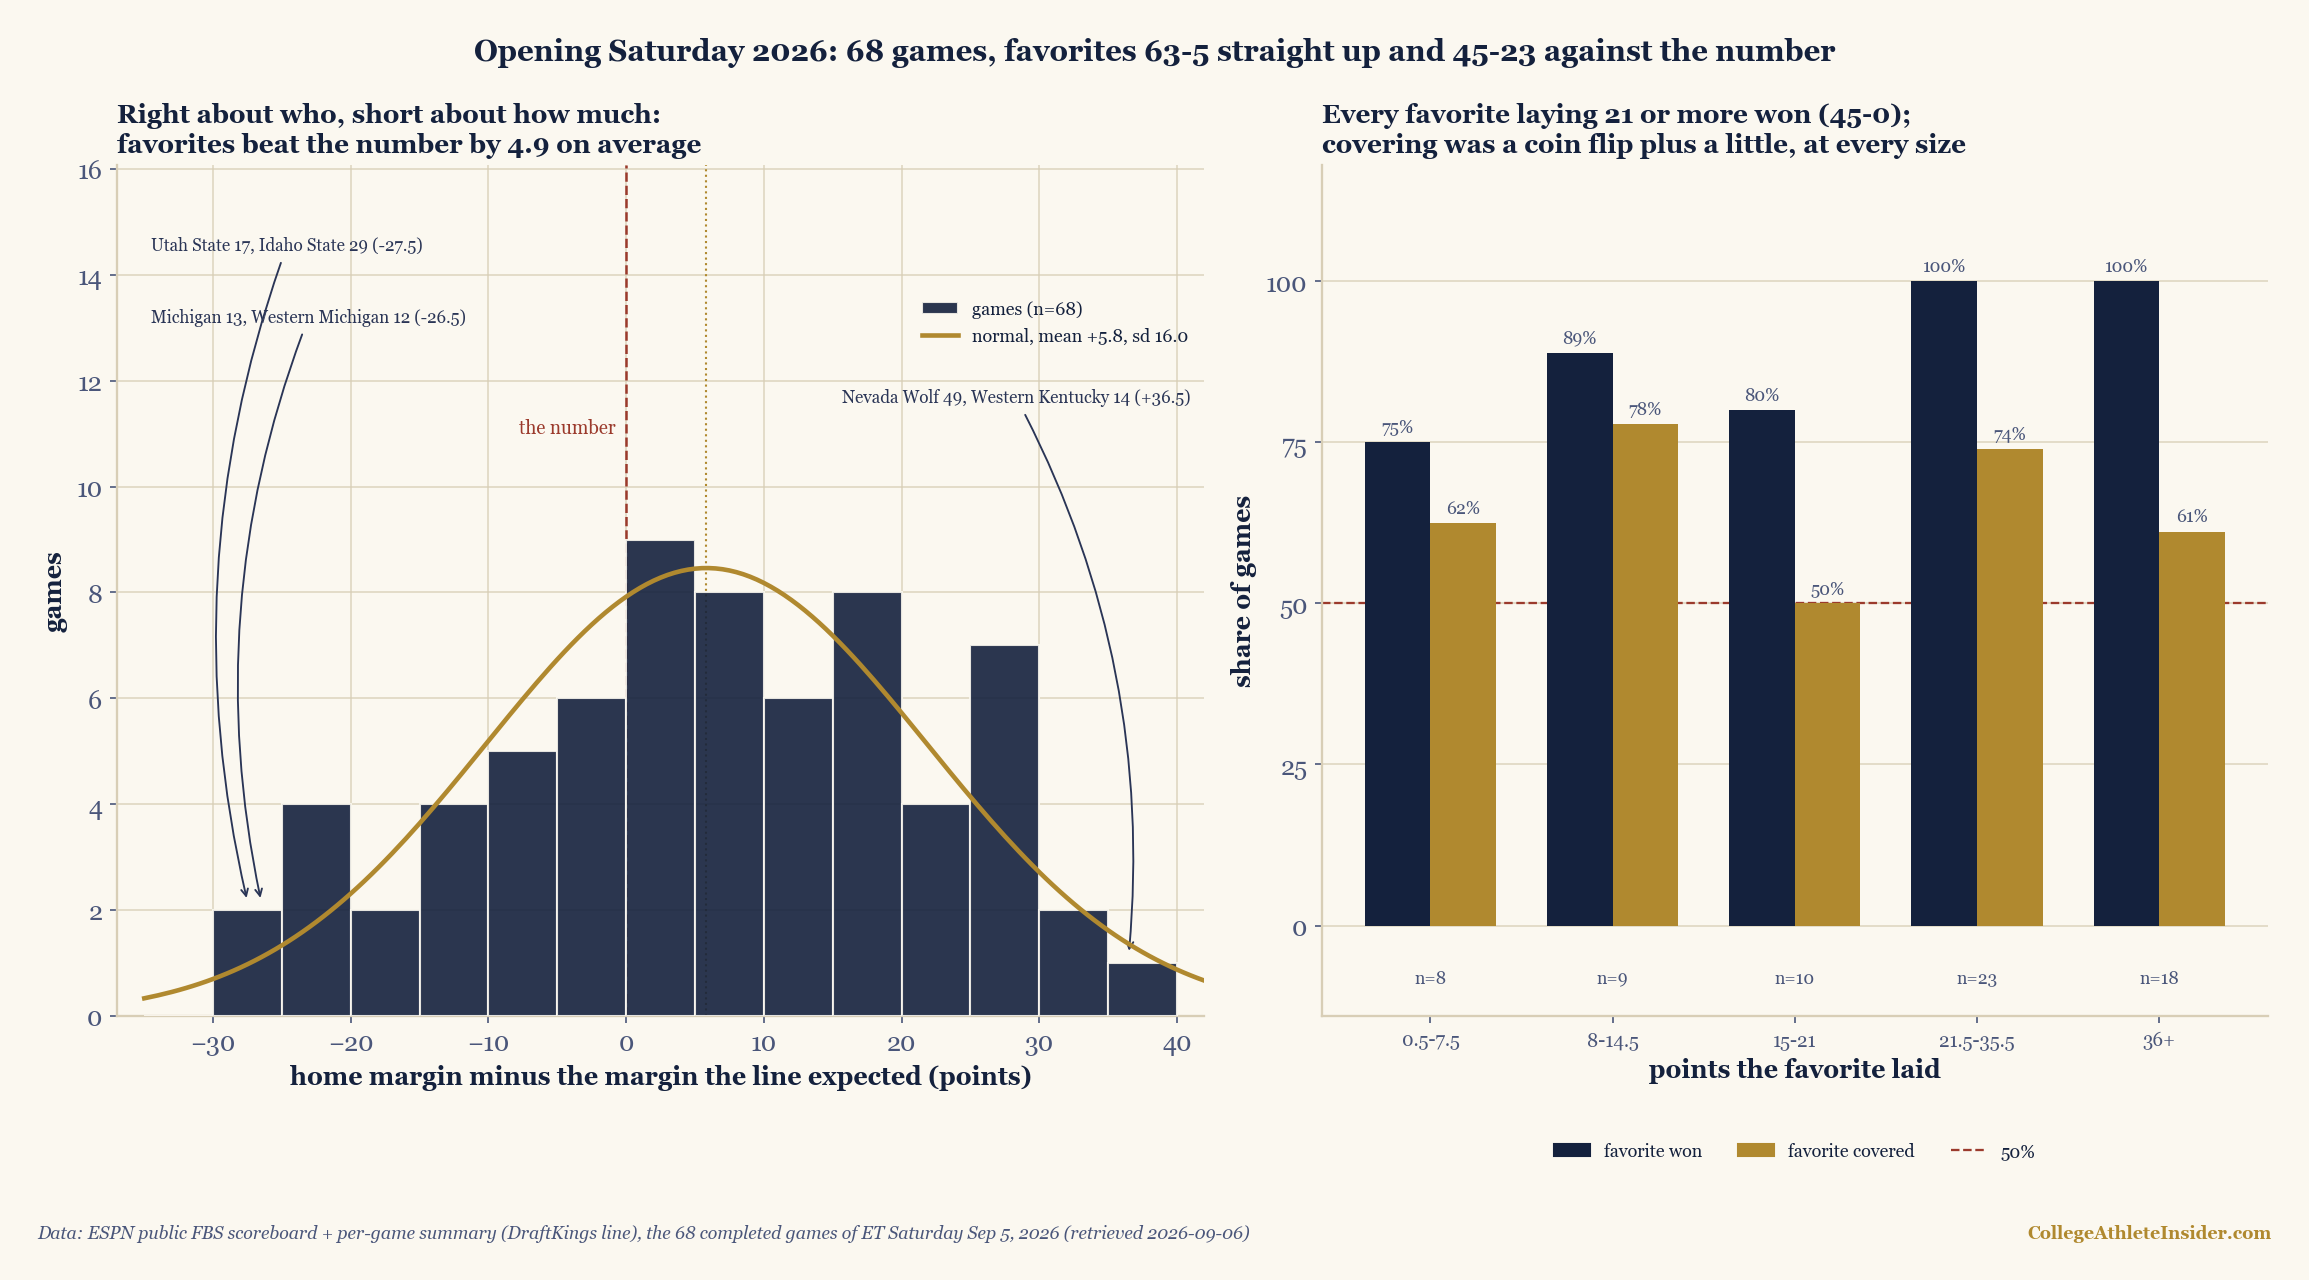
charts/chart_week1_2026_saturday.py — 145 checks.Right about who, short about how much
The favorite-side residuals have a mean of +4.86 and a sample standard deviation of 16.36. With 68 games the standard error of that mean is 1.98, so the day’s tilt toward favorites sits at z = 2.45. One Saturday is not a market study; the shape of the miss is still worth having on record. The median absolute miss was 12.25 points. Only 20 of 68 games finished within a touchdown of the number, 38 within two, and 18 missed by three touchdowns or more. From the home side the residual runs +5.83 with a standard deviation of 16.03 — and that last figure is the one I would frame. The site’s spread-to-probability piece uses a working sigma of 16 for FBS, chosen from prior seasons. Opening Saturday reproduced it to the decimal.
Take that sigma seriously and 63–5 stops looking like magic. Summing Φ(spread/16) over the 68 lines gives 60.5 expected favorite wins; 63 happened. In the 30 FBS-versus-FBS games the curve expected 24.8; 28 happened. Vig-free money lines agree on the 50 games that have one: 42.57 expected favorite wins, 45 actual. The market was, if anything, slightly too modest about its own favorites, by two or three games, which is inside the noise of one card.
| Favorite laid | Games | Favorite W–L | Covered | Mean laid | Mean margin |
|---|---|---|---|---|---|
| 0.5 to 7.5 | 8 | 6–2 | 5 | 3.8 | 5.4 |
| 8 to 14.5 | 9 | 8–1 | 7 | 12.4 | 18.3 |
| 15 to 21 | 10 | 8–2 | 5 | 19.4 | 23.2 |
| 21.5 to 35.5 | 23 | 23–0 | 17 | 28.1 | 34.1 |
| 36 and up | 18 | 18–0 | 11 | 43.9 | 48.8 |
| All 68 | 68 | 63–5 | 45 | 26.1 | — |
Read “mean margin” against “mean laid” and the tilt is in every row: favorites out-ran their number by 1.6, 5.9, 3.8, 6.0, and 4.9 points. Every favorite asked to give 21 or more won, 45–0, covering 30 of the 45; under 21 they went 18–5 and 15–8. The median line was 25.5 points, which is the real explanation for 63–5: this was less a card of football games than a card of exhibitions with a few games attached.
The road, and the FCS visitors
Thirty-eight of the 68 games — 55.9% — had exactly one FBS side, the paid non-FBS visitor that the buy-game piece priced across a full season. The hosts were favored in all 38, went 35–3, won by 37.5 on average, and covered 25 times. The three FCS wins were Tarleton State 20–13 at Bowling Green (the host laid 1.5, so barely an upset), Idaho State 29–17 at Utah State (the host laid 15.5), and The Citadel 43–41 at Charlotte in three overtimes, where the host laid 20.5. That last one is the largest spread any underdog overturned all day.
The 30 games between FBS teams are where the road finding lives. Home teams went 28–2. Four visitors were favored; UNLV and UCLA won, Oklahoma State and Western Kentucky lost. The other 26 visitors were all underdogs and all lost: 0–26. Across all 68 games road underdogs went 3–61, the three wins being the FCS trio above. So the day had five upsets by the line, and the biggest FBS one was a road favorite failing: Oklahoma State, favored by 13.5 at Tulsa, lost 24–10, at a money line that made the Cowboys an 80.4% proposition with the vig removed. The other, Nevada, is the day’s largest miss in the opposite direction: a 1.5-point underdog to Western Kentucky, it won 49–14, a residual of +36.5. LSU over Clemson (51–10 laying 10) and App State over Maine (55–3 laying 21) tied for second at +31.
A worked example: Charlotte, priced two ways
Charlotte laid 20.5 to The Citadel. On the site’s sigma-16 curve that is Φ(20.5/16) = Φ(1.28) = 0.900. The money line was −1650 against +950; convert each to an implied probability (1650/1750 = 0.943 and 100/1050 = 0.095), normalize the pair so they sum to one, and the book’s own number is 0.908. Two independent routes to the same 90%, less than a point apart, and the host lost in triple overtime. That is what a 10% event looks like, and on a 68-game card you should expect roughly one favorite of that size to go down — which is roughly what happened. Michigan was the near miss on the same curve: laying 27.5, a 0.957 favorite, it won by a single point.
The ranked teams
Fifteen ranked teams played on Saturday, every one at home; no ranked visitors, no ranked-versus-ranked games. They went 15–0 and 9–6 against the spread, with a mean residual of only +2.8 against +5.4 in the 53 games with no ranked side. Six ranked hosts failed to cover: No. 2 Oregon by 17.5 (34–27 over Boise State laying 24.5), No. 6 Indiana by 3.5, No. 12 Texas Tech by 22.5 against Abilene Christian, No. 16 Michigan by 26.5, No. 20 Tennessee by 2.5, and No. 23 Houston by 8. Eleven of the fifteen faced an FBS opponent. If there is a market read in the day it is that the number was tightest on the teams it knew and loosest on the ones nobody ranks, the same information gap the weeknight piece found from the schedule side. That piece’s schedule-only rule went 63–5 on Saturday, 92.6%.
Margins and totals
The mean winning margin was 33.0, the median 31. 49 of 68 games ended by 21 or more, 30 by 35 or more, 15 by 50 or more; only 8 finished inside one score. Nine shutouts, and four hosts reached 70: Louisiana Tech 80–6 over Northwestern State was the widest final, then Virginia Tech 73–3 and Kansas State 71–3. The closest were Auburn 17–16 over Baylor on the day’s only neutral field, Michigan 13–12, Charlotte’s 43–41 loss, and Troy 24–21 over Sam Houston. The totals, unlike the sides, were priced flat: mean total 54.0 against a mean over/under of 54.0, overs 37–31. What the market missed on Saturday was not the scoring; it was the split of it.
Conference by conference
Scoring each FBS team under its own conference: the SEC went 13–0 (9–4 against the spread, eight of the thirteen against FBS opponents) and the Big Ten 10–0 (7–3, eight against FBS). The Big 12 went 9–2 but only 5–6 against the number; the Sun Belt 9–4 and 8–5; the American 8–5 and 7–6; the Mountain West 5–3; the ACC 4–3; Conference USA 3–5 but 5–3 against the spread; the reconstituted Pac-12 2–4; and the MAC 1–7, 2–6 against the spread. The MAC lost all six of its games against FBS opposition, Bowling Green lost its buy game to Tarleton State, and its one win was Sacramento State’s, a program the feed now tags as a MAC member, over Mississippi Valley State. As hosts, the SEC’s thirteen home games beat the number by 8.7 points on average and the ACC’s five by 11.5, while Big Ten hosts (+0.9) and Big 12 hosts (+1.3) were priced almost exactly. None of these are conference-strength findings; with eight to thirteen games each and buy games making up most of the SEC and Sun Belt cards, they are opening-day inventory.
Limits
The line is ESPN’s, the day after. The summary endpoint carried one provider per game and no timestamp, so I cannot say whether each number is the close or the last one ESPN captured; nothing here is a claim about closing-line value. The 18 largest spreads had no money line, so that comparison covers 50 games, all under a 37.5-point line. Sixty-eight games is one card: the +4.9 tilt has a standard error of 2 points, the bucket rows hold 8 to 23 games, and every conference row is a handful. FBS classification is by conference id, the same proxy as the weeknight file; ESPN now tags North Dakota State and Sacramento State with FBS conference ids, so both count as FBS hosts here although each appears in the 2024 cache only twice, as FCS programs. Rankings are ESPN’s curatedRank, verbatim. And the feed labels this whole window week 1, which is why the builder filters on the Eastern date.
Sources
ESPN public scoreboard, site.api.espn.com/apis/site/v2/sports/football/college-football/scoreboard?dates=YYYYMMDD&groups=80&limit=300, UTC days 2026-09-05 through 2026-09-08; ESPN per-game summary, site.api.espn.com/apis/site/v2/sports/football/college-football/summary?event=<id>, its pickcenter block, for the DraftKings spread, total, and money lines; ESPN conference groups, sports.core.api.espn.com/v2/sports/football/leagues/college-football/seasons/2026/types/2/groups/80/children, for conference names. All retrieved September 6, 2026 and saved as data_layer/week1_2026_saturday.json. The sigma-16 curve is the working estimate from the spread-to-probability piece; the tools on the calculators page run the same conversion on any line.
So the ledger for Saturday reads: favorites 63–5, 45–23 against the number, road underdogs 0–26 between FBS teams, one 90% favorite beaten, one 96% favorite saved by a point, and a market that priced the scoring exactly and the split of it five points low. Next week the median line will not be 25.5, and that is when the number starts to be worth arguing with.