Some teams win games they had no business winning. Others lose games they dominated. Over a full season those flukes mostly cancel out — but not always, and the teams where they don't cancel are the ones whose records lie. The tool for catching them is second-order wins, a concept popularized by Bill Connelly: an estimate of how many games a team should have won based on how it actually played, independent of the final scoreboard.
The one-sentence version: second-order wins ask "given how this team performed, game by game, how many of these should it have won?" — and the gap between that number and its real record is, mostly, luck.
From box score to "win expectancy"
The engine underneath is postgame win expectancy. The idea is to take the things a team controlled in a given game — its efficiency (success rate), how many scoring opportunities it created, how well it finished those drives, the field position it played from, and its turnover margin — and ask how often a team that performed that way wins. Not "did it win," but "what share of the time does this stat line beat this opponent's stat line?"
That share is the game's win expectancy. A team that thoroughly outplayed its opponent but lost on a last-second field goal might have a postgame win expectancy of 0.85 — it would win that same game 85% of the time — even though it went 0-1 on the day. A team that got outgained badly but won on three takeaways and a kick-return touchdown might post a win expectancy of 0.30 despite the W.
Adding it up: second-order wins
Sum a team's postgame win expectancies across the whole season and you get its second-order win total — the number of wins its game-by-game performances "deserved." Compare that to actual wins:
- If actual wins > second-order wins, the team won more than it earned. It was, on balance, lucky.
- If actual wins < second-order wins, the team lost games it played well enough to win. It was unlucky.
Crucially, "luck" here isn't an insult and it isn't mystical. It's the catch-all for the parts of football that are close to random over a season: the bounce of an oblong ball, whether a 50-50 fumble is recovered by the right team, whether a coin-flip 4th-quarter drive ends in a touchdown or a punt, and special-teams variance like a doinked field goal or a returned kick. These things decide individual close games but are devilishly hard to repeat on purpose.
A clearly-illustrative example
The team and numbers below are invented for illustration — not a real season — but they show exactly how the gap is read. Imagine the Hypothetical State Badgers finish 10-2:
| Game type | Games | Actual W-L | Avg. win expectancy |
|---|---|---|---|
| Comfortable wins | 6 | 6-0 | 0.90 |
| Close wins (one score) | 4 | 4-0 | 0.45 |
| Losses | 2 | 0-2 | 0.30 |
Add the expectancies: (6 × 0.90) + (4 × 0.45) + (2 × 0.30) = 5.4 + 1.8 + 0.6 = 7.8. So this 10-2 team has about 7.8 second-order wins — call it an 8-4 team that went 10-2. The tell is in the second row: the Badgers went a perfect 4-0 in games they'd win less than half the time. Winning every coin flip is wonderful and almost impossible to sustain. The model is flagging, in advance, that this team's record is running ahead of its play.
Why the gap predicts regression
Here's the payoff: the close-game and turnover luck that creates a big actual-vs-second-order gap does not carry over well from one season to the next. A team's underlying quality — how efficiently it moves the ball and stops the other guy — is reasonably sticky year to year. Its record in one-score games and its turnover margin are much closer to coin flips. So a team that vastly outran its second-order wins tends to fall back the next season even if it returns the same players, and a team that badly underran its second-order wins tends to bounce up.
This is why a sharp analyst, looking at our fictional 10-2 Badgers, would quietly bet the under on next year's win total — not because the team is bad (a true 8-4-caliber team is good), but because 10 wins built on a 4-0 record in coin-flip games is the kind of thing that regresses. The flip side is the team everyone writes off after a 6-6 season that was really an 8-4 performance drowned in bad luck; that's a classic breakout candidate.
How it complements returning production
Second-order wins answer "how good was this team, really?" — a question about the season that just happened. Returning production answers a different one: "how much of that team is coming back?" Put them together and you get a genuinely useful preseason picture. A team that played like an 8-4 squad (regardless of a flukey 10-2 or 6-6 record) and returns most of its production is a stable bet to be good again. A team whose record was propped up by luck and is losing key players is a double red flag. The two metrics measure different things — performance quality vs. continuity — and that's exactly why they're stronger together than either alone.
It also pairs naturally with the building-block stats. The same per-play efficiency and explosiveness figures that feed win expectancy are the ones that tend to persist, which is why ratings like SP+ — built on performance, not record — usually agree with second-order wins about who was actually good.
This season's biggest over- and under-performers
How to use it — and how not to
- It's a quality measure, not a moral one. "Lucky" doesn't mean a team didn't deserve its wins; the games count. It means the record is unlikely to be a reliable guide to next year.
- Mind the sample. Twelve games is a small season. A gap of half a win is noise; a gap of two-plus wins is a real signal worth acting on.
- Don't double-count special teams. Elite or awful special teams can be a genuine, semi-repeatable edge, not pure luck. A great kicker is a real asset — though even great kickers are streakier than offenses.
- Combine, don't isolate. Use it alongside efficiency ratings and returning production. On its own it tells you who got lucky; together they tell you who's about to be over- or underrated.
The standings tell you what happened. Second-order wins tell you what should have happened — and over a long enough run, what should happen is the better bet. When you hear next August that a 10-win team is "due for regression" or a .500 team is "a sleeper," check the gap. More often than not, the number saw it coming.
Try it yourself
Put the formula from this piece to work on your own numbers. It runs entirely in your browser — nothing is sent anywhere. For the full set, see the Calculators hub.
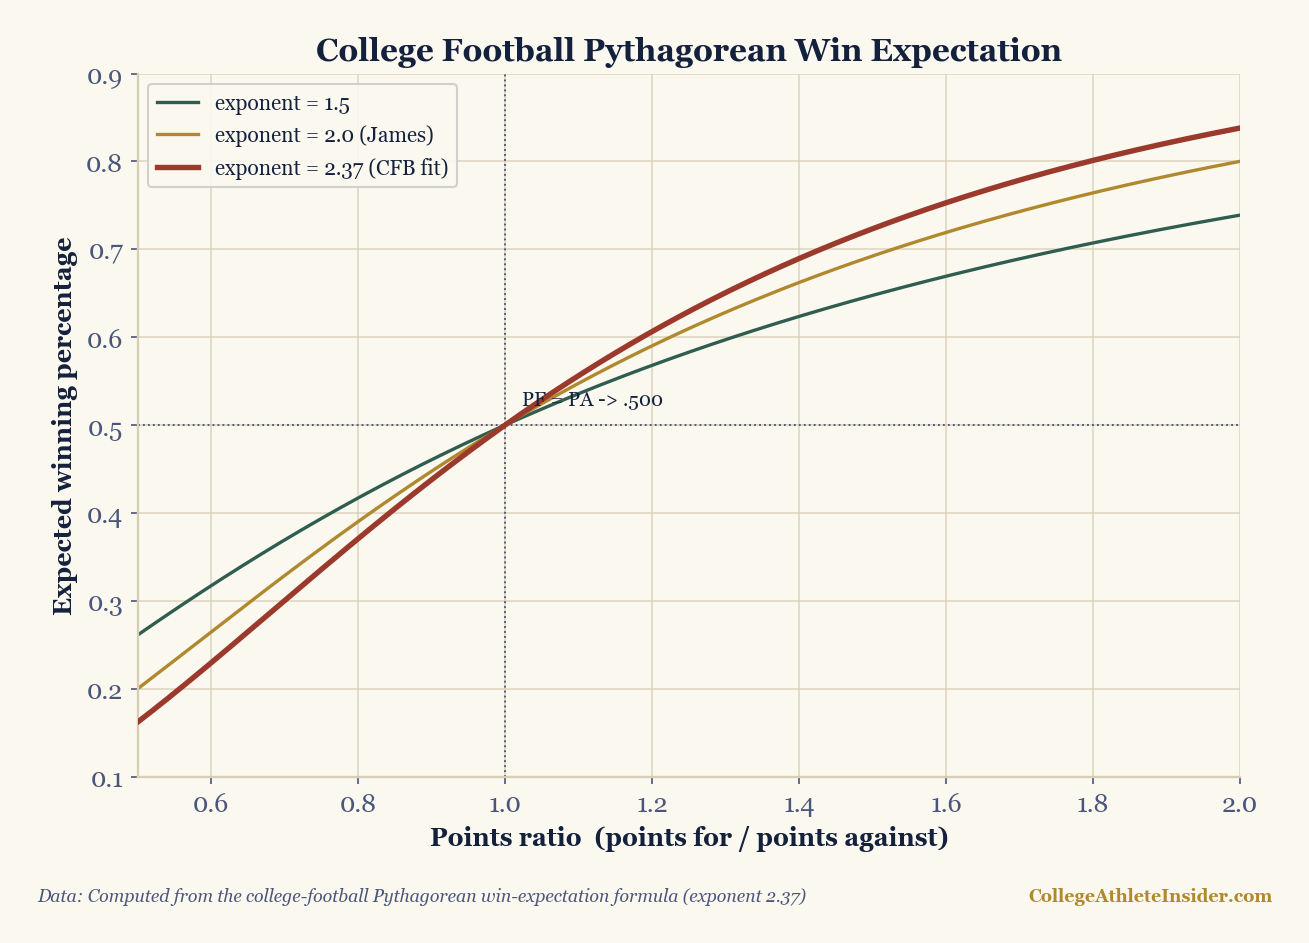
Pythagorean expectation (CFB)
Turn a team's points-for and points-against into an expected win percentage, using the college-football exponent of 2.37. A team beating this number has been lucky in close games.
Pure math on the numbers you enter. Nothing is fetched and no real team, player, or result is named or invented.
Sources & further reading
- Theory: Chapter 11: Efficiency Metrics (EPA, Success Rate) — a free chapter at DataField.dev.
- CollegeFootballData.com — collegefootballdata.com (play-by-play, postgame win expectancy inputs; free API key)
- ESPN — espn.com (game results and box scores)
- Related: Is returning production predictive? · How SP+ works · Explosiveness and yards per play