Elo — the rating system invented for chess and borrowed by every sport since — is the friendliest way to build your own power ranking. There's no matrix algebra, no optimizer, just one update rule applied after every game: the winner takes points from the loser, and the size of the transfer depends on how surprising the result was. In about 30 lines of Python we'll rate every FBS team from real results, then check how often it would have called the winner. Full code is in scripts/cfb-elo-rating-python.py.
The one formula you need
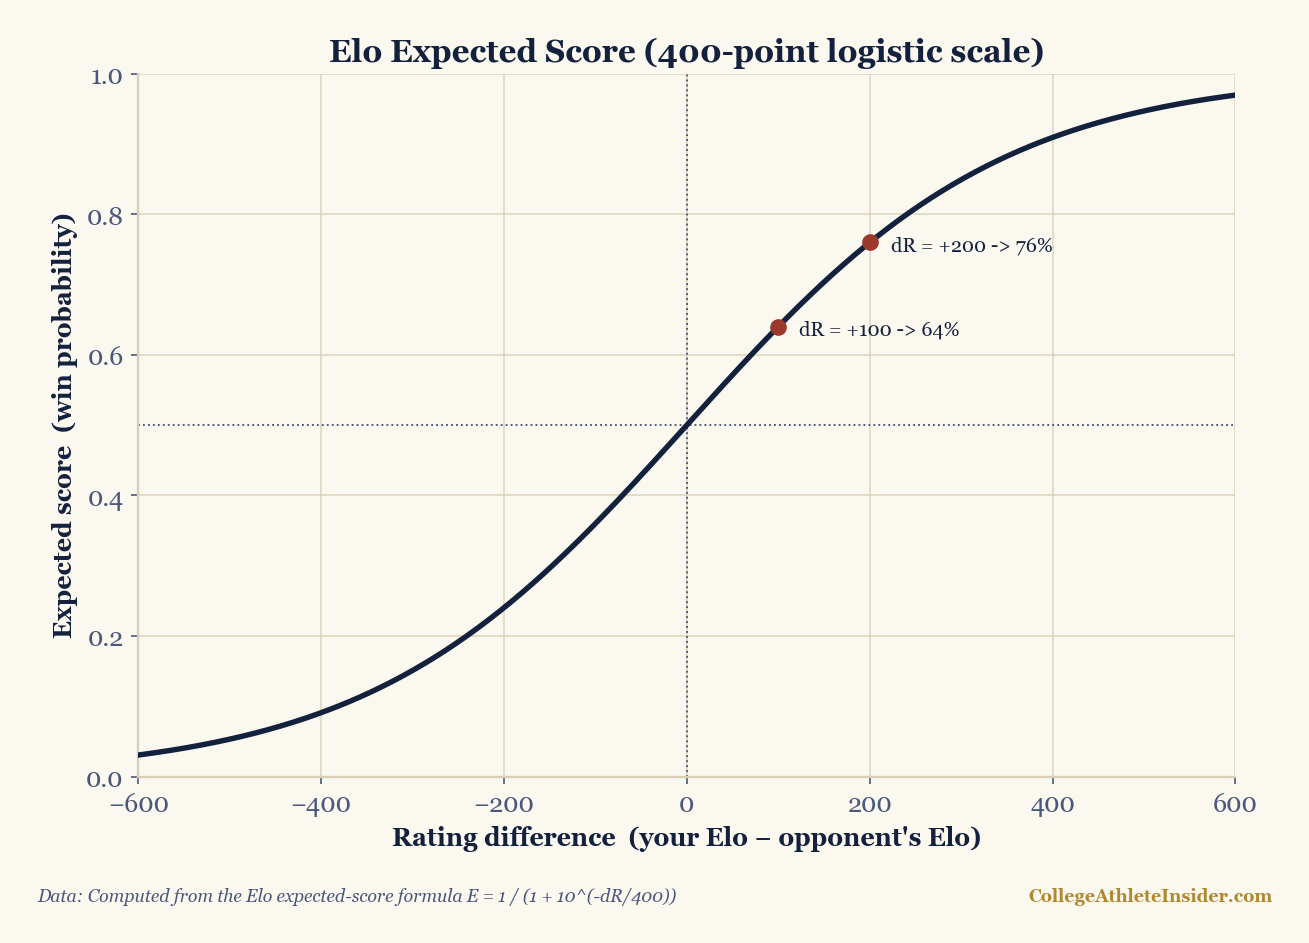
Before a game, each team has a rating (everyone starts at 1500). The favorite's expected win probability is:
def expected(a, b):
return 1 / (1 + 10 ** ((b - a) / 400))After the game, you nudge each rating toward what actually happened:
new_rating = old_rating + K * (actual - expected)actual is 1 for a win, 0 for a loss. K is the step size — bigger K means ratings move faster. We use K = 40 and give the home team a +65 Elo bump for home-field before computing the expectation.
Run it over a season
Pull the season's games in order (we use the shared _cfb_season helper over ESPN's public results), then loop:
elo = {}
for g in games:                       # games sorted by week
    rh = elo.get(g["home"], 1500)
    ra = elo.get(g["away"], 1500)
    eh = expected(rh + 65, ra)        # home-field in the expectation
    home_won = 1 if g["hs"] > g["as"] else 0
    elo[g["home"]] = rh + 40 * (home_won - eh)
elo[g["away"]] = ra + 40 * ((1 - home_won) - (1 - eh))The result, and a back-test
While we loop, we can also check the rating's predictive value: did the higher pre-game rating (plus home-field) win? On the 2024 season:
Back-test: predicted the winner in 604/873 = 69.2% of games.

Top 15 by Elo:
 1  ORE    1698     6  IU     1639     11  CLEM  1619
 2  BOIS   1669     7  SMU    1633     12  OSU   1618
 3  ND     1664     8  PSU    1631     13  ARMY  1617
 4  ASU    1649     9  TEX    1630     14  SC    1617
 5  UGA    1645    10  MRSH   1629     15  OHIO  1616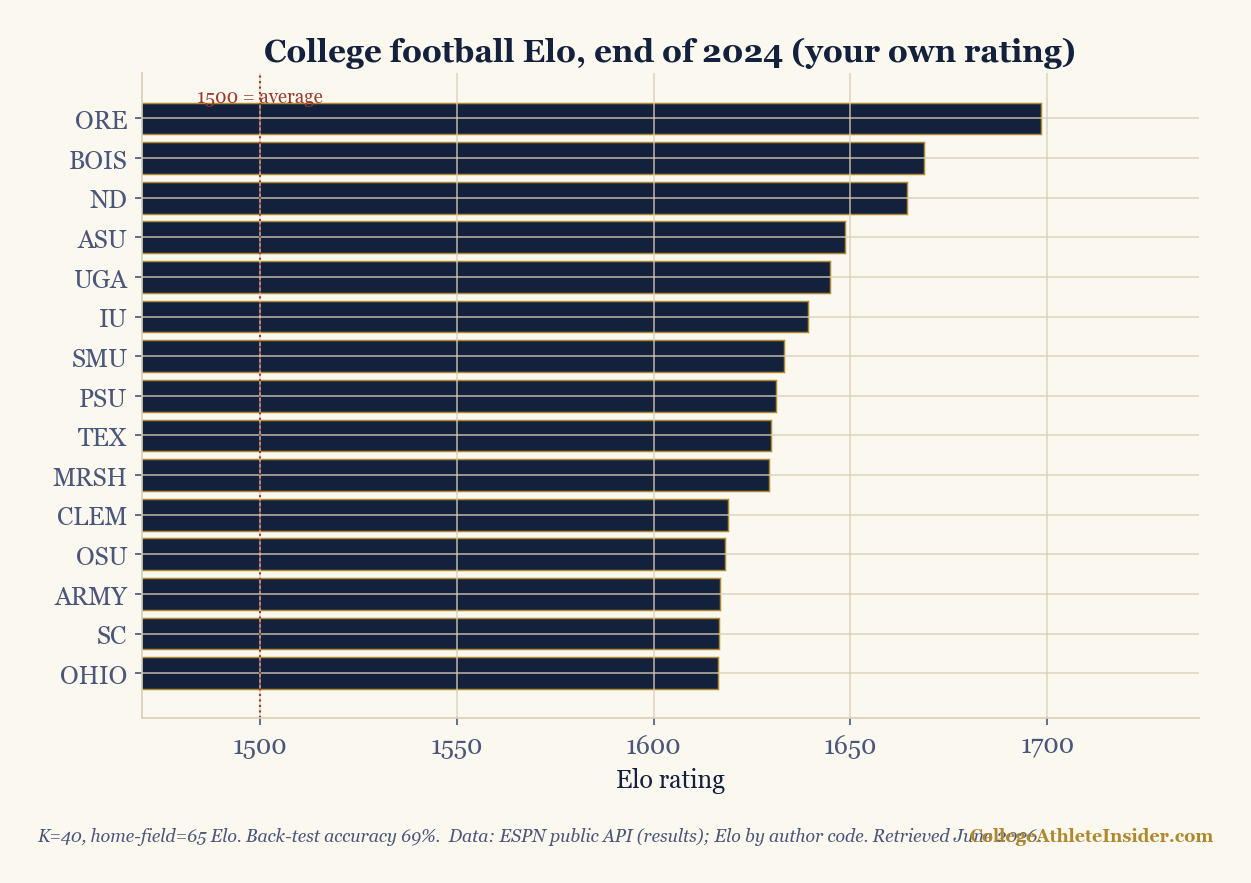
Predicting ~69% of games from one number is genuinely good — and it exposes Elo's nature. Notice Ohio State sits 12th, even though the Buckeyes won the national championship. Pure Elo only knows results, and Ohio State lost two regular-season games (to Oregon and Michigan) before getting hot in the playoff. Elo doesn't reward "peaking at the right time"; it rewards a body of work. That's a feature for prediction and a quirk for crowning champions — exactly the tension we explore in choosing a champion.
Make it better
- Margin of victory. Multiply
Kby a function of the score margin (with diminishing returns) so blowouts move ratings more than one-point wins — but cap it to avoid rewarding running up the score. - Preseason priors. Instead of starting everyone at 1500, carry over a fraction of last year's rating. Early-season predictions improve a lot.
- Tune K and home-field. Re-run the back-test with different values and keep what predicts best. That's a one-line experiment now.
- Regress to the mean between seasons so a great team doesn't start the next year overrated.
Elo is the gateway drug of sports analytics: simple enough to understand fully, powerful enough to beat the polls at prediction. Once it's working, the logistic-regression tutorial shows how to turn that Elo edge into a calibrated win probability.
Try it yourself
Put the formula from this piece to work on your own numbers. It runs entirely in your browser — nothing is sent anywhere. For the full set, see the Calculators hub.
Elo win probability
Give the rating gap between two teams and get the favorite's win probability from the Elo logistic. Add any home-field bonus to the home rating before you take the difference.
Pure math on the numbers you enter. Nothing is fetched and no real team, player, or result is named or invented.
Sources & further reading
- Free textbook: Chapter 18: Game Outcome Prediction — the theory behind this, at DataField.dev.
- ESPN public API (results) — via
scripts/_cfb_season.py - Companion code:
scripts/cfb-elo-rating-python.py - Related: A basketball Elo · Win probability with logistic regression