Between the moment DraftKings hung its numbers on today's college football card and 9:54 this morning, the spreads on 79 of the 80 FBS games being played on Saturday, September 12, moved a combined 158 points. That sounds like a market in a panic, and it is not one. Line each game's movement up against what its two teams did to their own numbers in week one, and across the 51 games where both teams had a priced opener, one plain rule explains about 42% of the variation: for every point a team beat its week-one spread by, its week-two line moved about a tenth of a point its way. Michigan beat Western Michigan by one as a 27.5-point favorite and went from laying 2.5 against Oklahoma to getting 5.5. And the reacting finished early. The movement that tracks week one had happened by Wednesday; what the lines did after that has no measurable relationship with week one at all. The market heard the opener at a tenth of full volume and stopped listening by midweek.
Three prices for the same game
This morning data_layer/build_week2_2026_line_moves.py pulled ESPN's public FBS scoreboard for the 80 games with an Eastern kickoff date of today. It ran at 9:54 a.m. Eastern, 126 minutes before the first of 14 noon kickoffs, and it refuses to save anything if a game has started; all 80 were still scheduled. Each game carries one provider, DraftKings, with an open and a field ESPN labels close. Before kickoff that second field is just the current number, so I call it the Saturday-morning line: six of today's games kick off at 10 p.m. Eastern or later, and nothing here is a closing line. ESPN's per-game summary endpoint agreed with the scoreboard on every spread and total.
The same games are already on disk as they stood on Wednesday, September 9, in the file behind the week-one information piece, so each game has up to three prices. 79 have an opening and a current spread; Alabama State at Troy carries a total and no spread, and is left out rather than guessed. Of the 79, 52 were priced on Wednesday and 27 have been priced since, every one a game with a single FBS side.
Sixty-four of the 79 spreads moved and 15 did not. The average move was 2.0 points; 25 games moved three or more and nine moved five or more. On the site's working curve, Φ(spread/16), the average win probability shifted 2.8 percentage points. Four favorites changed sides: Oklahoma at Michigan, Mississippi State at Minnesota, California at Syracuse, and Ohio State at Texas, which opened a pick'em and is now Texas by 1.5. The movement lived in the real games: the 45 all-FBS games moved 2.59 points on average off a median opening number of 11.5, the 34 games with one FBS side 1.22 off a median of 29.0.
What the lines did not do was lean toward favorites. Thirty-five opening favorites grew, 28 shrank, 15 held, and the average favorite's number rose 0.13 points, even though the opening-Saturday piece found last week's favorites beating the number by 4.86 a game. Totals moved without a lean too: 57 of 80 changed, 27 up and 30 down, an average of −0.15, the largest South Florida at Army from 52.5 to 45.5.
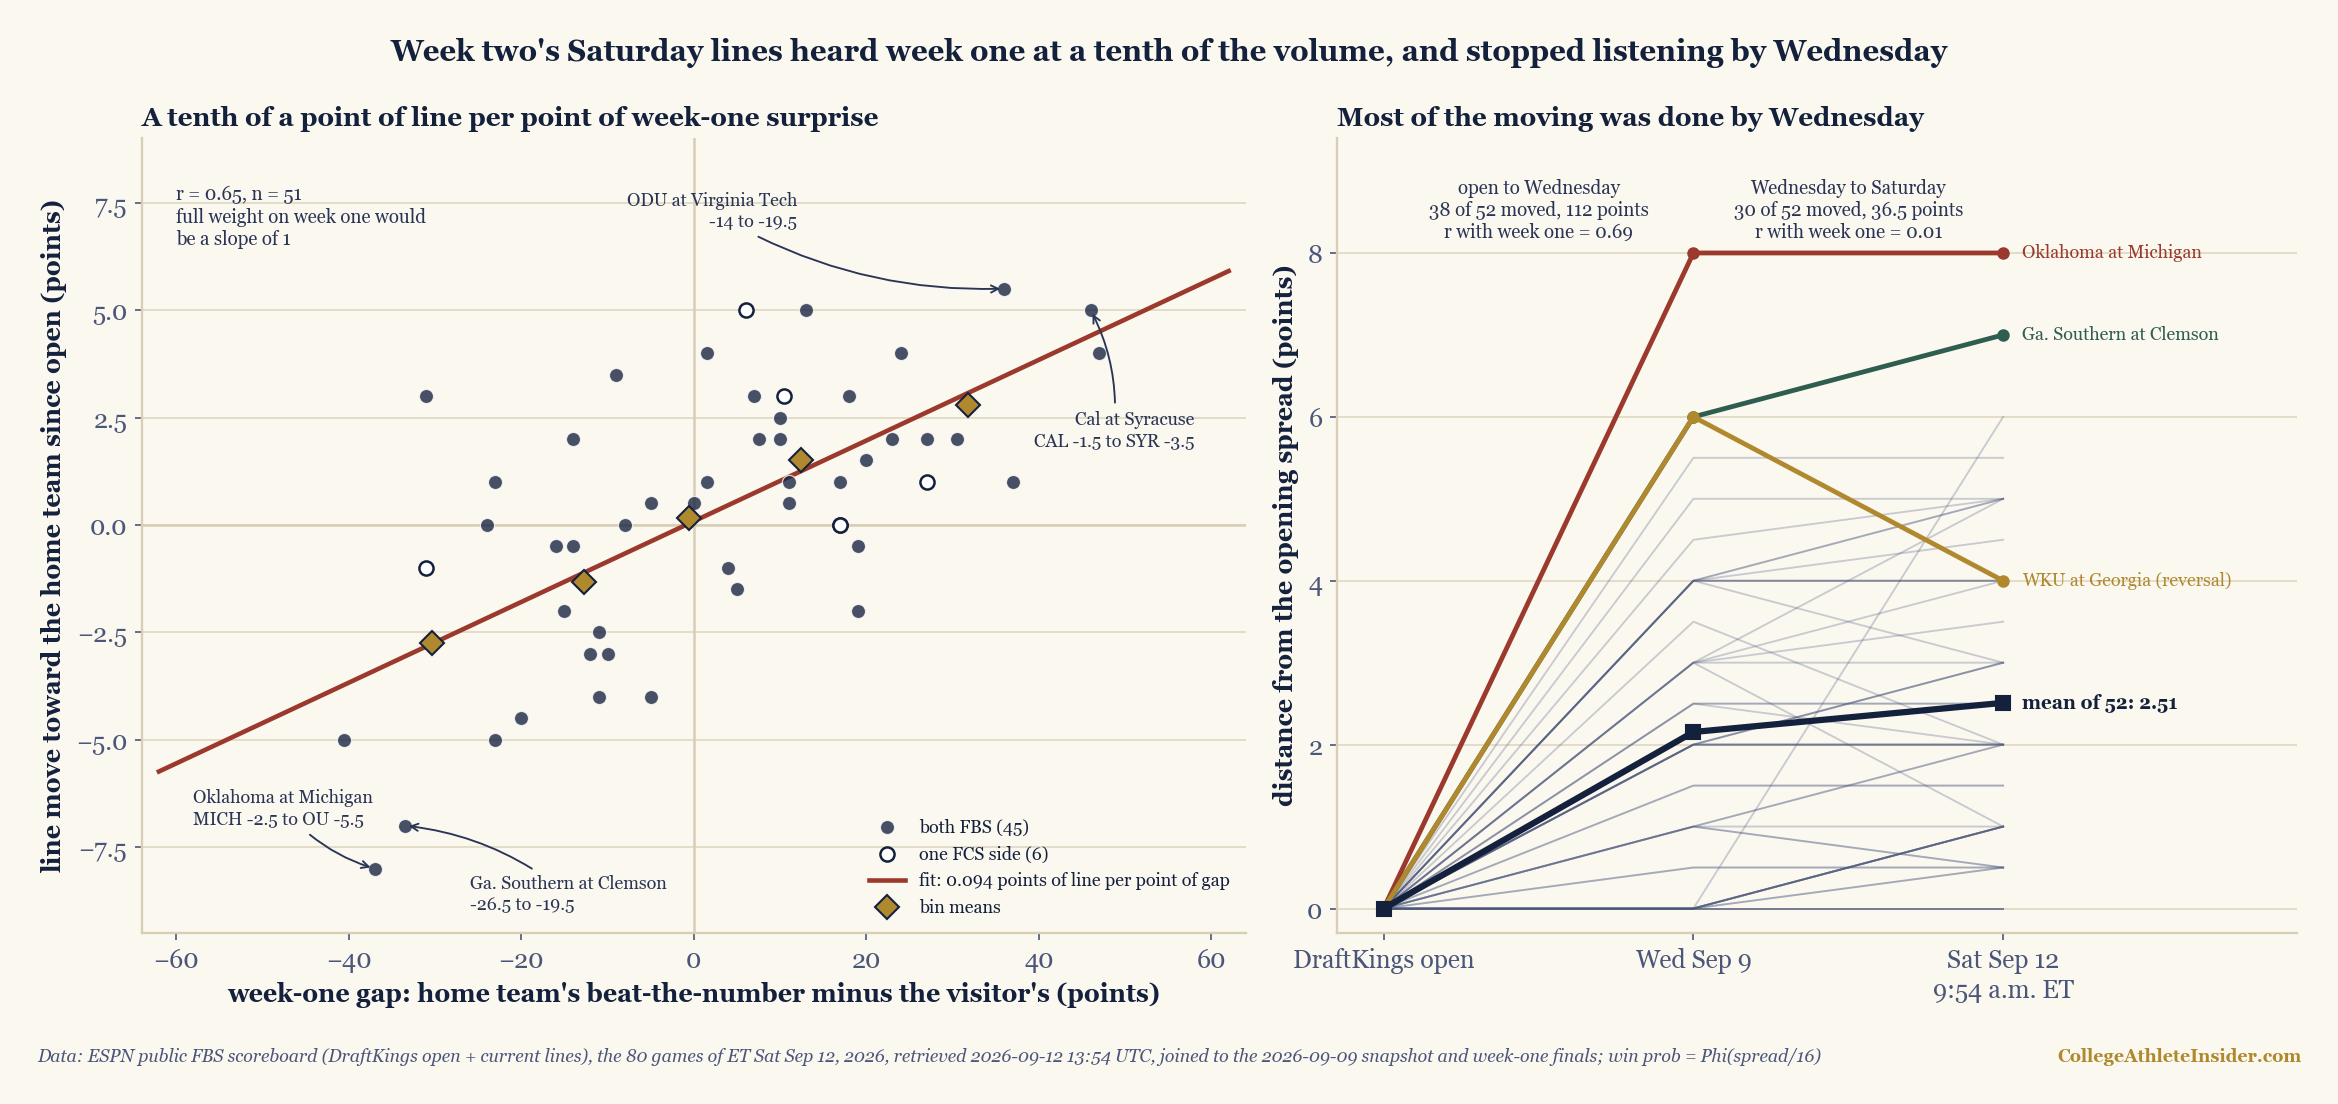
charts/chart_week2_2026_line_moves.py — 151 checks.A tenth of a point per point
A team's week-one residual is its margin plus its own spread: how many points it beat or missed its number by. For a Saturday game the gap is the home team's residual minus the visitor's, and the move is the opening home spread minus this morning's, so a positive move came toward the host. Across the 51 games where both teams played a priced opener:
move = 0.085 + 0.0939 × gap, with r = 0.645 (r² = 0.416).
The binned version needs no regression. Where the gap was 20 or more against the host, 8 games, lines moved 2.75 points away from it. Between 5 and 20 against, 11 games, 1.32 away. Within five either way, 6 games, +0.17. Between 5 and 20 for the host, 16 games, 1.50 toward it; 20 or more, 10 games, 2.80. Thirty-seven of the 51 moved the way week one pointed, nine against it, four not at all.
I tried to break it. The rank correlation is 0.590. In 10,000 seeded shuffles of the moves, none matched the real correlation. A 10,000-draw bootstrap puts the slope between 0.059 and 0.126. Without Michigan it is 0.085; on the 45 all-FBS games, 0.0996. Fitted on the two teams' residuals separately, the host's counts 0.113 and the visitor's −0.076, both the expected direction. Every version lands near a tenth.
A worked example: Oklahoma at Michigan
Michigan opened a 2.5-point home favorite over Oklahoma, which ESPN ranked 11th this morning, at money lines of −142 and +120. On the curve that is Φ(2.5/16) = Φ(0.15625) = 0.5621. With the vig removed the money lines agree: −142 implies 142/242 = 0.5868, +120 implies 100/220 = 0.4545, together 1.0413, so Michigan's share is 0.5868/1.0413 = 0.5635.
By Wednesday it was Oklahoma by 5.5, and still is, at Michigan +170 and Oklahoma −205. Michigan's curve probability is now 1 − Φ(0.34375) = 0.3655, a drop of 19.66 points, the largest on the card. The money lines: +170 implies 0.3704, −205 implies 0.6721, together 1.0425, share 0.3704/1.0425 = 0.3553.
Now week one. Michigan beat Western Michigan 13–12 laying 27.5, a residual of 1 − 27.5 = −26.5. Oklahoma beat UTEP 51–0 laying 40.5: 51 − 40.5 = +10.5. The gap is −26.5 − 10.5 = −37.0, and the rule predicts 0.085 + 0.0939 × (−37) = 0.085 − 3.474 = −3.39. The line moved −8.0, leaving 4.61 points the rule does not explain. The file does not say what they are, so I will not guess.
Two other big movers sit closer to the line. Clemson lost 51–10 at LSU as a 10-point underdog (−31.0) while Georgia Southern beat Charleston Southern 31–0 laying 28.5 (+2.5), and Clemson's number against the Eagles fell from 26.5 to 19.5. Syracuse beat New Hampshire 66–3 laying 35.5 (+27.5), California lost 45–24 at home to UCLA as a 2.5-point underdog (−18.5), and California went from a 1.5-point road favorite at Syracuse to a 3.5-point underdog.
Done by Wednesday
The 52 games priced on Wednesday have all three prices, and the path is lopsided. From the open to Wednesday, 38 moved, 112.0 points in total; from Wednesday to this morning, 30 moved, 36.5. That is 75.4% of the distance travelled before Wednesday. Eight reversed; Western Kentucky at Georgia went from 35.5 to 41.5 and back to 39.5.
The two stages were reacting to different things. On the 47 of those games with a week-one gap, the open-to-Wednesday move correlates 0.689 with the gap; the Wednesday-to-Saturday move, 0.012. Whatever moved 30 lines in the last three days, it was not the opener. That is also my best evidence about when the opens were hung: ESPN gives no timestamp, but numbers that move with week-one results were almost certainly posted before those results existed.
It also checks a caveat I printed on Wednesday. The information piece valued these 52 games at 32.8 bits and warned the lines would move. At this morning's numbers they are worth 32.93. It counted 28 unpriced games as zero and offered an imputation of 0.238 bits apiece; the 27 of them now priced are worth 0.277 each. The imputation was conservative, as it claimed.
Is a tenth timid?
The preseason-poll piece weights results by n / (k + n), with k the games' worth of trust a preseason view gets. After one game that is 1/(k + 1): 0.167 at its moderate k = 5, 0.111 at its heavy k = 8. Solving 1/(k + 1) = 0.0939 gives k ≈ 9.6. By that yardstick DraftKings trusts its preseason numbers more than the heaviest case the site modeled.
The competing reading is at least as good. One final scatters about 16 points around the line. If the market thinks its preseason number for a team carries a normal error of τ, the efficient weight on one game is τ² / (τ² + 16²), and 0.0939 corresponds to τ ≈ 5.2 points. A tenth is what you would do if you trusted your August number to about five points, the same instinct the record-shrinkage piece defended with four imaginary games of .500. The model is loose, since each residual also carries the week-one opponent's error, so treat τ as a scale, not an estimate.
Which reading is right can be tested. Every game on this card now has an open and a Saturday-morning number saved, and once the scores are final, whichever sat closer to the margins by mean absolute error is the better-informed price. One Saturday is a thin test, but none of these games has been played yet, so it is still more than anyone has this morning.
Limits
The open has no timestamp. That most opens predate week one is inferred from the correlation, and 11 of the 27 games priced since Wednesday show an open identical to the current number, so some opens were hung late. The Saturday number is a snapshot taken at 9:54 a.m.; the night games have more than twelve hours left to move. One book, DraftKings as ESPN carries it. Points, not prices: the juice is ignored, and 57 of the 64 games with both money lines saw them change. The week-one lines are not verified closes; they are what ESPN kept after each opener, as in the Saturday piece. Correlation is not a mechanism: an opener produces a score and also news, such as an injury, and this cannot separate a reaction to the margin from a reaction to what the game revealed. The sample is 51 games from one week, and the slope's bootstrap range runs from about a sixteenth to an eighth. FBS membership uses the house conference-id proxy with North Dakota State and Sacramento State excluded by name, and ESPN's feed numbers weeks differently from this site, so the builder keys on the Eastern date.
Sources and reproducibility
ESPN public scoreboard, site.api.espn.com/apis/site/v2/sports/football/college-football/scoreboard?dates=YYYYMMDD&groups=80&limit=300, UTC September 12 and 13, 2026, its DraftKings odds block (open and current spread, total, money lines); ESPN per-game summary, .../summary?event=<id>, its pickcenter block as a cross-check. Retrieved 13:54 UTC on September 12, 2026 by data_layer/build_week2_2026_line_moves.py and saved with the raw odds blocks as data_layer/week2_2026_line_moves.json; ESPN does not keep these blocks for past games, so this file is the only copy. Wednesday prices and week-one finals come from data_layer/weeks_1_2_2026_lines.json, retrieved September 9. Every figure is recomputed by charts/chart_week2_2026_line_moves.py, which runs 151 checks, including the seeded permutation and bootstrap, and refuses to draw the chart if one fails. The spread-to-probability curve is from the point-spread piece, and the calculators page converts any line the same way.
The easy story about a betting market is that it overreacts: a team wins ugly and the number lurches. Today's card does not tell that story. The numbers moved, and moved a lot, but about a tenth as far as the week-one scores alone would have pushed them, and they did it in the first half of the week. Whether a tenth was right is a question for tonight, and the answer will be in the same file.