"Home-field advantage is worth about three points" is one of those facts everyone repeats. Where does the number come from, and is it right for college football? You can answer it yourself with a season of real results and two lines of arithmetic — and the raw answer comes out bigger than three, for a reason worth understanding. Full code: scripts/cfb-home-field-advantage-python.py.
The simplest measurement
Take every completed game on the season scoreboard and look at the home team's margin (a handful are neutral-site dates; with only 20 of 873 flagged neutral, excluding them moves the results by a few tenths):
from _cfb_season import season_games
games = season_games(2024)
margins = [g["hs"] - g["as"] for g in games]
home_win_rate = sum(m > 0 for m in margins) / len(margins)
avg_home_margin = sum(margins) / len(margins)
The result
873 games. Home win rate: 63.8%. Average home margin: +8.6 points.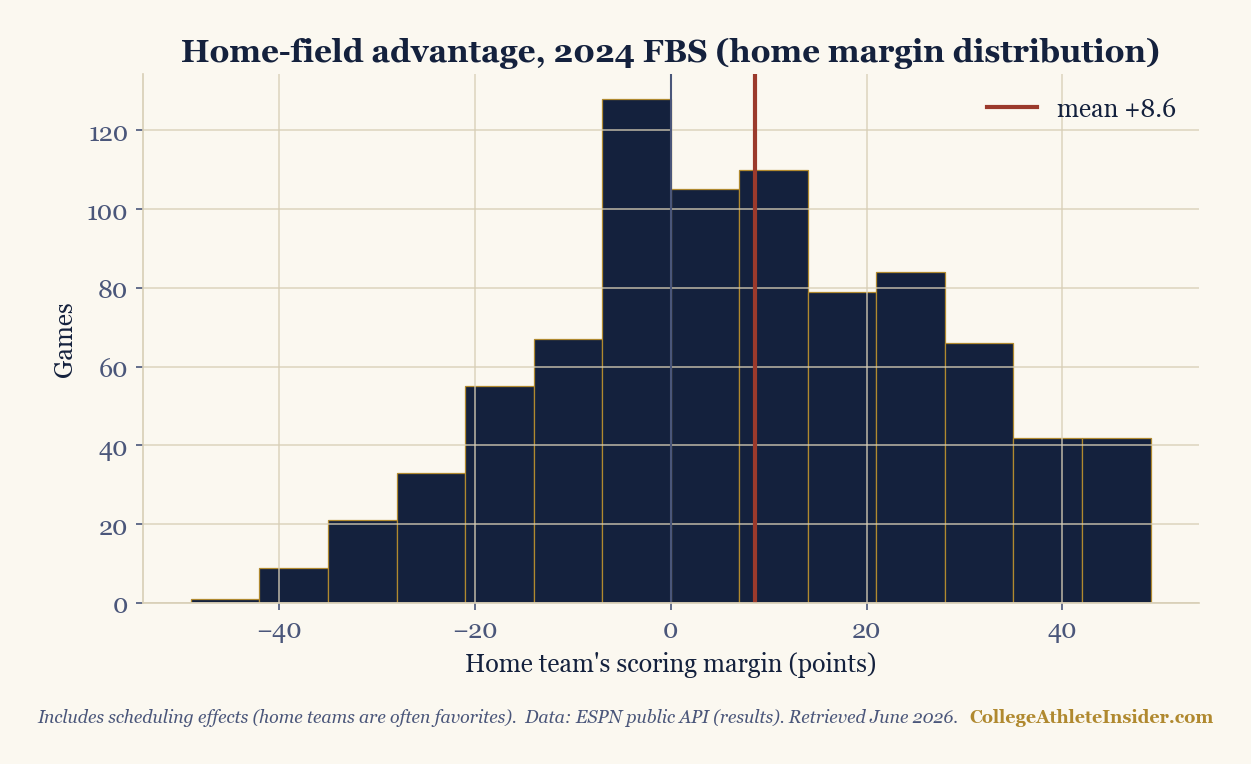
Why +8.6, not +3?
Here's the crucial lesson, and it's about confounding, not arithmetic. That +8.6 is not pure home-field advantage. It bundles two things:
- True home-field advantage — crowd, travel, familiarity (the genuinely causal part, usually estimated around 2-3 points).
- Scheduling bias — home teams are often the better team. Powerhouses buy home games against weaker opponents ("guarantee games"), so the home side is favored before the venue matters at all.
The raw home margin measures both at once. To isolate true home-field advantage, you have to control for team quality — for example, by adding a home-field term to a rating model (our Elo tutorial uses a +65 Elo bump, ≈2-3 points) and letting the data fit it, or by looking only at games between evenly matched teams. Do that and the causal estimate shrinks toward the familiar few points.
A better estimate
The clean way: fit ratings with a home-field parameter and read it off directly. In an Elo or regression framework, you let the model explain results with team strength plus a single home constant; whatever the model assigns to "home" is your estimate, already controlled for who was playing. That's the number to quote — not the raw +8.6. I've since run exactly that fit on this same cached season in Home-Field Advantage, Measured: the home constant comes out to +3.0 points.
Takeaways
- Raw home margin overstates HFA because home teams are often favorites. Always ask what a number is confounded with.
- Home win rate ~64% is real and useful for context, but it's a blend of venue and mismatch.
- To get the causal piece, control for quality — a home term in a model is the standard tool.
- It varies by venue — altitude, crowd size, and travel make some homes worth more than others.
This tutorial is really about a habit: when a number looks too big, find what else it's measuring. Home-field is the textbook case.
Sources & further reading
- Chapter 3: Python for Sports Analytics covers the foundations; it’s free to read at DataField.dev.
- ESPN public API (results) — via
scripts/_cfb_season.py - Companion code:
scripts/cfb-home-field-advantage-python.py - Related: Build an Elo rating (with a home-field term) · Predicting games