Ninety-one games of college football were played between Thursday September 3 and Monday September 7, 2026, and every one of them carried a number. Convert those numbers into the only currency that matters for a season opener — how much you did not already know — and the week comes to 34.83 bits. That is roughly thirty-five coin flips. It took ninety-one games to produce it, which works out to 0.383 bits a game: you learn as much from tossing a coin once as from watching two and a half opening-weekend football games. Then the week actually played, and it delivered 31.21 bits, about ten percent under what it was priced to deliver, because favorites went 83–8 and favorites were supposed to. Meanwhile the card that kicks off tomorrow night is smaller and worth more: week two has 86 games, 58 of them priced as of this morning, and those 58 alone are worth 35.04 bits. The season's biggest Saturday was also one of its emptiest.
What a bit of football is
The measure here is not mine. Take the site's working assumption that an FBS game's margin scatters around the spread with a standard deviation of about 16 points — the number the spread-to-probability piece adopted from prior seasons, and the number opening Saturday's residuals reproduced at 16.03. A favorite laying S points is then a Φ(S/16) proposition. The information you expect to gain by watching a two-outcome event of probability p is its binary entropy,
H(p) = −[ p·log₂(p) + (1−p)·log₂(1−p) ] bits,
which is exactly 1 bit when p is a half and falls toward zero as the line grows. This is Shannon's 1948 quantity, and its whole appeal is that it is additive: the news in a card is the sum of the news in its games, so a Saturday can be totalled the way a box score can. The result you actually get is worth its surprisal, −log₂ of the probability the model assigned to what happened — small when the favorite wins, large when it does not. Sum entropy over a slate and you have what the slate was priced to teach you. Sum surprisal after the fact and you have what it taught.
Two honest caveats before any number below. First, this is a property of Φ(spread/16), not of football; it measures the market's uncertainty, not the universe's. Second, sixteen is a choice, and I show below exactly which findings survive changing it.
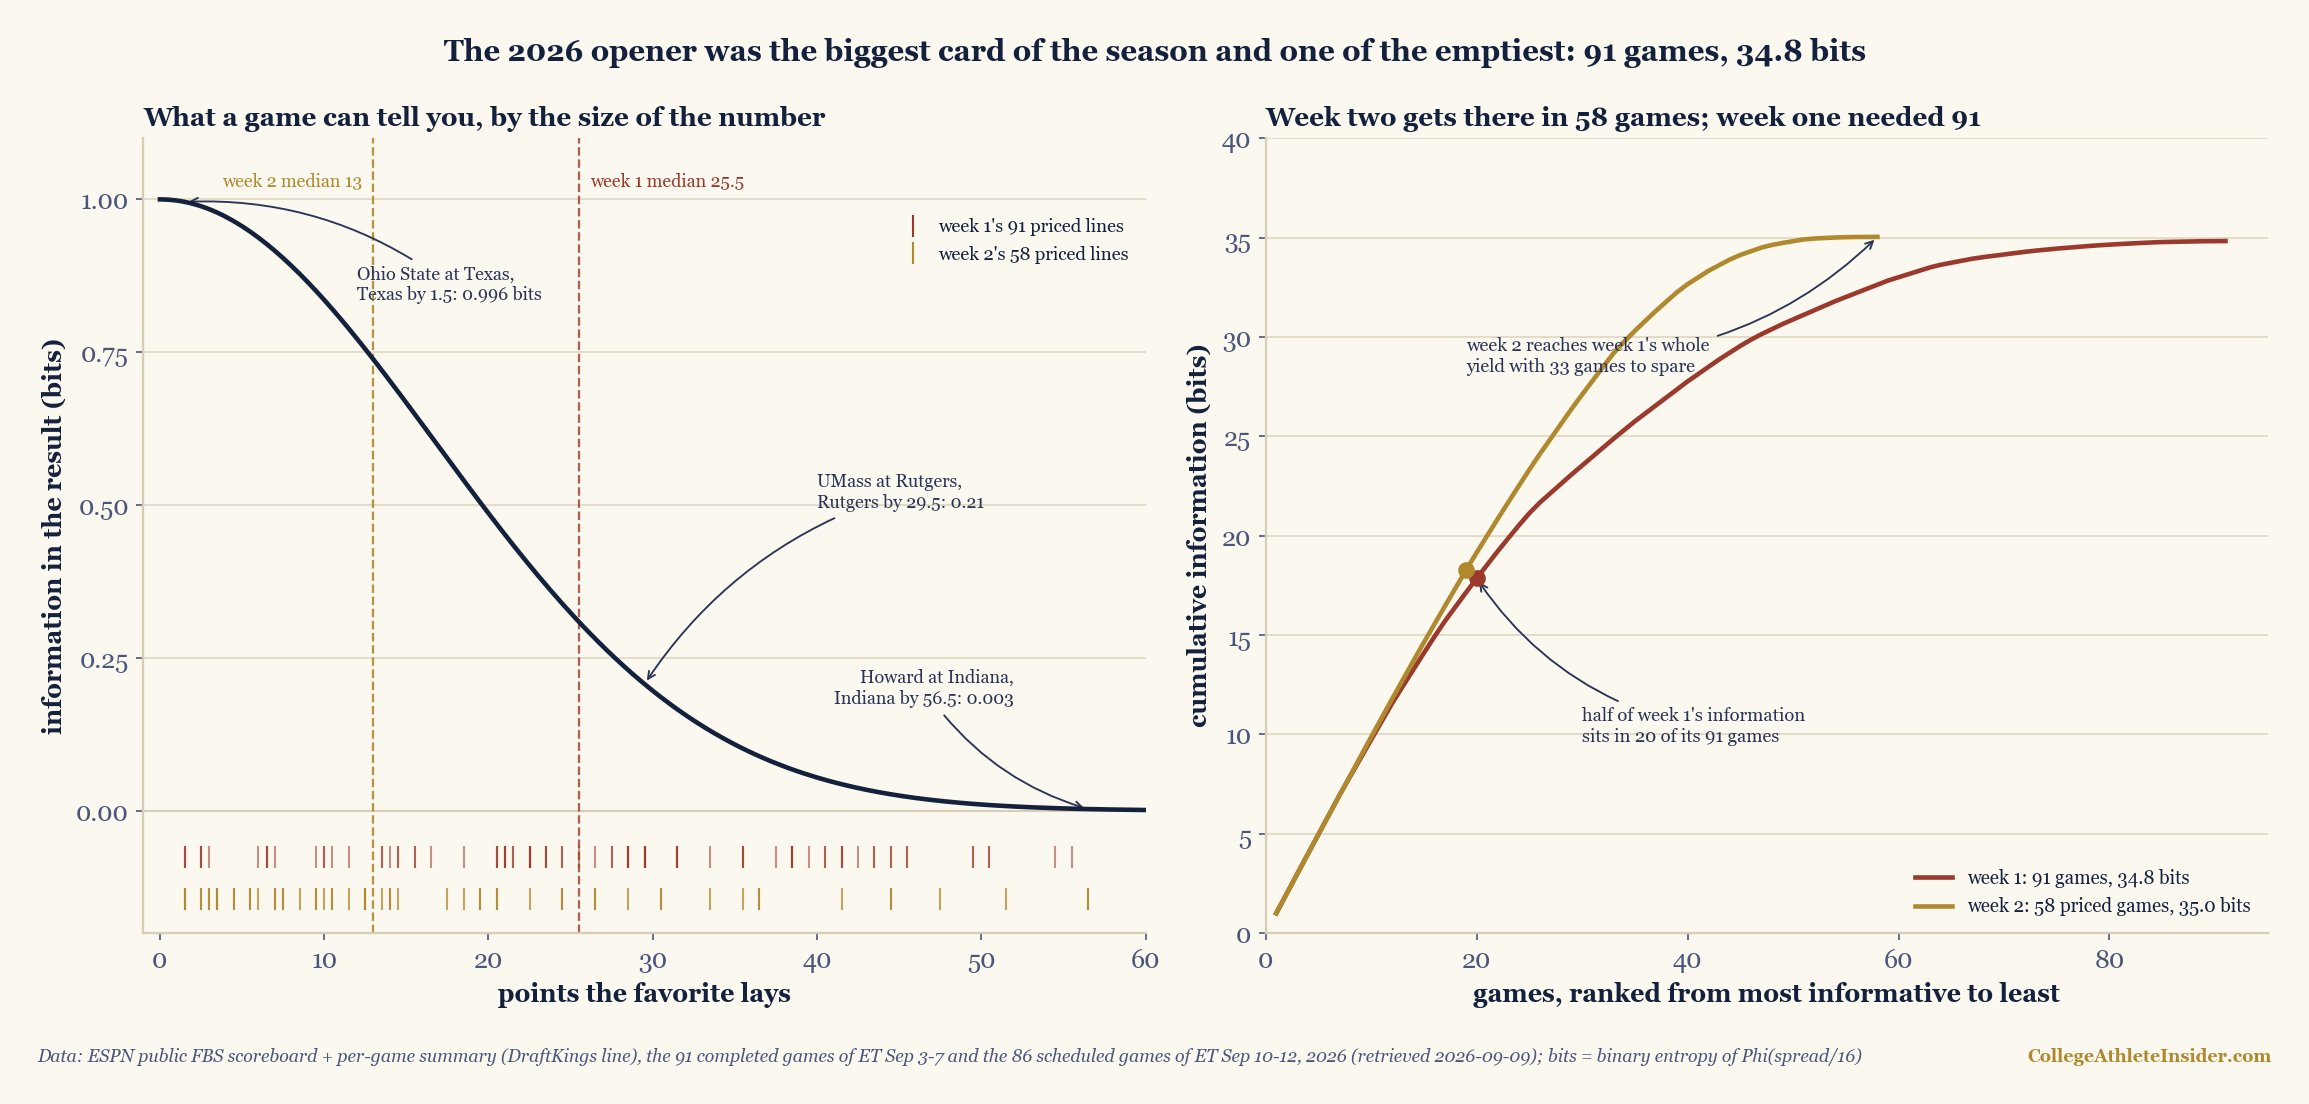
charts/chart_week1_2026_bits.py — 115 checks.Where week one's information actually was
Ninety-one games, every one of them priced, is a capacity of 91 bits if each were a toss-up. The card delivered 38.3% of that. The distribution is the story: half of the week's information sat in 20 of its 91 games, 22% of the card, and the 40 quietest games were priced at 3.72 bits between them. Twenty-four games were worth a tenth of a bit or less, sixteen were worth a twentieth or less. The quietest was Arkansas–Pine Bluff at Missouri, the host laying 55.5, at 0.0035 bits. Three games sat within a point and a half of a pick’em and were therefore worth 0.996 each: San José State at Eastern Michigan, Tarleton State at Bowling Green, and Western Kentucky at Nevada.
The split by opponent is the mechanism, and it is the one the buy-game piece has been describing for a season. Forty-eight of week one's games had exactly one FBS side; they carried 11.44 bits between them, 0.238 a game, off a median line of 31.5. The 43 games between two FBS teams carried 23.38 bits, 0.544 a game. So a little over half the card produced under a third of the news. Opening Saturday by itself — 68 games, the largest single day on the 2026 calendar — was worth 26.13 bits. The Thursday night window that the weeknight piece covered was worth 2.95 across 11 games; Friday 3.01 across 8; Sunday 1.75 across 3; and the Monday nightcap, SMU at Florida State with the visitor laying 3, 0.98 on its own.
| Card | Games | Priced | Bits | Per game | Median line |
|---|---|---|---|---|---|
| Week one, FBS vs FBS | 43 | 43 | 23.38 | 0.544 | 21.0 |
| Week one, one FBS side | 48 | 48 | 11.44 | 0.238 | 31.5 |
| Week one, all | 91 | 91 | 34.83 | 0.383 | 25.5 |
| Week two, FBS vs FBS | 47 | 47 | 31.80 | 0.677 | 11.5 |
| Week two, one FBS side | 39 | 11 | 3.24 | 0.294 | 36.5 |
| Week two, all | 86 | 58 | 35.04 | 0.604 | 13.0 |
A worked example: Rutgers laying 29.5
Rutgers opened the season at home against Massachusetts and laid 29.5 points. On the sigma-16 curve that is z = 29.5/16 = 1.84375, and Φ(1.84375) = 0.9674; the visitor's chance is 0.0326. The entropy is
H = −[0.9674 × log₂(0.9674) + 0.0326 × log₂(0.0326)] = −[0.9674 × (−0.0478) + 0.0326 × (−4.9397)] = 0.0463 + 0.1610 = 0.2073 bits.
A fifth of a bit. Rutgers lost 37–21. The surprisal of that outcome is −log₂(0.0326) = 4.939 bits, which is 23.8 times what the game was priced to be worth and more than the 40 quietest games on the card were priced to yield between them. One result on a Thursday night in New Jersey was the single largest piece of news in the season's first week, and no preview had it on the marquee.
What the week delivered, against what it was priced to
Summing surprisal across all 91 finals gives 31.21 bits against the 34.83 the card was priced for — 89.6%. That is the arithmetic expression of favorites going 83–8: when the chalk holds slightly better than the curve expects, the week is quieter than advertised. It is a small deviation on one week and I would not read a market verdict into it; the Saturday piece reached the same conclusion from the other direction, with Φ(spread/16) expecting 60.5 favorite wins and 63 arriving.
The five loudest results, in bits delivered: UMass 37, Rutgers 21 (host laying 29.5) at 4.94; The Citadel 43, Charlotte 41 in three overtimes (20.5) at 3.32; Idaho State 29, Utah State 17 (15.5) at 2.59; Oklahoma State 10, Tulsa 24 (the road favorite laying 13.5) at 2.33; and Colorado 14, Georgia Tech 13 (6.5) at 1.55. Those five outcomes account for 14.7 of the week's 31.2 delivered bits. Everything else on 86 games was noise around expectation, which is what a week of 25.5-point median lines is built to be.
Week two, before a snap
The Saturday piece ended by predicting that next week's median line would not be 25.5. It is 13.0. Forty-seven of week two's 86 games are between FBS teams, up from 43, and they are priced at 0.677 bits each against week one's 0.544. Nineteen games sit at 0.9 bits or better, against twelve last week. The headline is week two's one ranked-versus-ranked meeting: Ohio State at Texas, the visitor ranked first and the host fourth in the ranking ESPN carried this morning, Texas laying 1.5, worth 0.996 bits, within four thousandths of a coin flip. Week one's one ranked-versus-ranked meeting, Louisville at Ole Miss on Sunday night, was worth 0.927.
Two caveats sit on that number. Twenty-eight of its games carried no line at all this morning, every one of them an FBS host with an FCS visitor, and I have counted them as zero rather than invent a number. If you price them at week one's buy-game average of 0.238 bits, they would add 6.68, taking week two to 41.71 bits across 86 games — still comfortably past week one, and the direction of that adjustment only helps the argument. And the week-two lines are three days out and will move; they are what DraftKings was showing through ESPN on September 9, not closes.
Limits
The totals depend on sigma, and the per-game figures do not. At sigma 13 the two weeks come to 27.10 and 31.05 bits; at 14, 29.69 and 32.46; at 16, 34.83 and 35.04; at 18, 39.78 and 37.31; at 20, 44.45 and 39.33. Somewhere between 16 and 18 week one's larger card overtakes week two's priced 58, so the claim “week two carries more information in total” is true at the site's working sigma and false at a wider one. The per-game gap never closes: week two's average priced game is worth between 1.4 and 1.8 times week one's across that whole range, 1.58 at sigma 16. That is the finding I would defend.
This is a measure of the market, not of the sport. A game the book prices at 56.5 is not certain; it is certain-looking to a book. If the line is wrong, the entropy is wrong in the same direction, and a slate of badly-priced games would look uninformative while actually being full of news. The line is ESPN's single provider. The summary endpoint carried one DraftKings entry per priced game with no timestamp, so nothing here is a claim about closing numbers, and the week-two block is a live quote taken on one morning. Rankings are ESPN's curatedRank, verbatim, at retrieval. FBS membership is by conference id, the 2024-cache proxy the house has used all season; ESPN now tags North Dakota State and Sacramento State with FBS conference ids, and both are excluded from the FBS-versus-FBS class here by name because the cache has them as FCS programs. And the feed labels this whole opening window week 1, which is why the builder filters on the Eastern kickoff date rather than the week field.
One thing this measure deliberately cannot do is tell you whether a game matters. A 0.003-bit game can still end a season through an injury, and a 0.996-bit game between two unranked Group of Five teams carries no playoff weight at all. Information is not importance. It is only the answer to a narrower question: before kickoff, how much did nobody know?
Sources and reproducibility
ESPN public scoreboard, site.api.espn.com/apis/site/v2/sports/football/college-football/scoreboard?dates=YYYYMMDD&groups=80&limit=300, UTC days 2026-09-02 through 2026-09-14; ESPN per-game summary, site.api.espn.com/apis/site/v2/sports/football/college-football/summary?event=<id>, its pickcenter block, for the DraftKings spread; ESPN conference groups for conference names. All retrieved September 9, 2026 by data_layer/build_weeks_1_2_2026_lines.py and saved as data_layer/weeks_1_2_2026_lines.json (177 games, 149 priced). Every figure above is recomputed from that file at every site build by charts/chart_week1_2026_bits.py, which runs 115 checks against the published numbers and refuses to draw the chart if one fails. The entropy measure is Claude Shannon's, from “A Mathematical Theory of Communication” (Bell System Technical Journal, 1948); the sigma-16 curve is the site's, from the spread-to-probability piece, and the calculators page converts any line the same way.
None of this argues that week one was worthless. It argues that its volume was misleading, which is a different complaint and a more useful one. Ninety-one games is a lot of television and not much evidence, and the sport spends the first Saturday of every season inviting people to update hard on a card built to confirm what everyone already believed. The Bayesian version of that argument asks how many games it takes for results to outweigh a preseason guess. The answer this week supplies is that not all games count the same toward that total, and the ones that count are the ones the book cannot call.