Every college football season runs on a particular kind of argument: we beat the team that beat the playoff team, so we belong in the conversation too. It feels like logic — if A beat B and B beat C, surely A is better than C. But football results are noisy, and a chain of them is much weaker evidence than it looks. Model the math and the verdict is brutal: in a tight, evenly matched league, “A beat B beat C” tells you A would beat C only about 51% of the time — a coin flip. The transitive argument, the backbone of half of all rivalry trash talk and playoff lobbying, is mostly an illusion.
Why transitivity feels true
In a world without luck, results would be perfectly transitive: rank every team by true strength, and the better team always wins, so chains of results never contradict each other. Our intuition is built for that clean world. Real games aren't clean — a tipped pass, a missed kick, a lucky bounce, and the worse team wins anyway. Once outcomes are part skill and part chance, a chain of three results stops being a logical proof and becomes a noisy hint, and a surprisingly faint one.
The model
Give every team a hidden true strength, and let a game's winner be drawn from the standard Elo win probability of the strength gap — bigger gap, more likely the stronger team wins, but never a sure thing. Now take three teams, look only at the cases where A beat B and B beat C, and ask the question the fans are really asking: in those cases, how often does A actually beat C? Crucially, the answer depends on one thing — how spread out the teams' true strengths are. A league of near-equals behaves completely differently from a league with clear haves and have-nots.
The exhibit
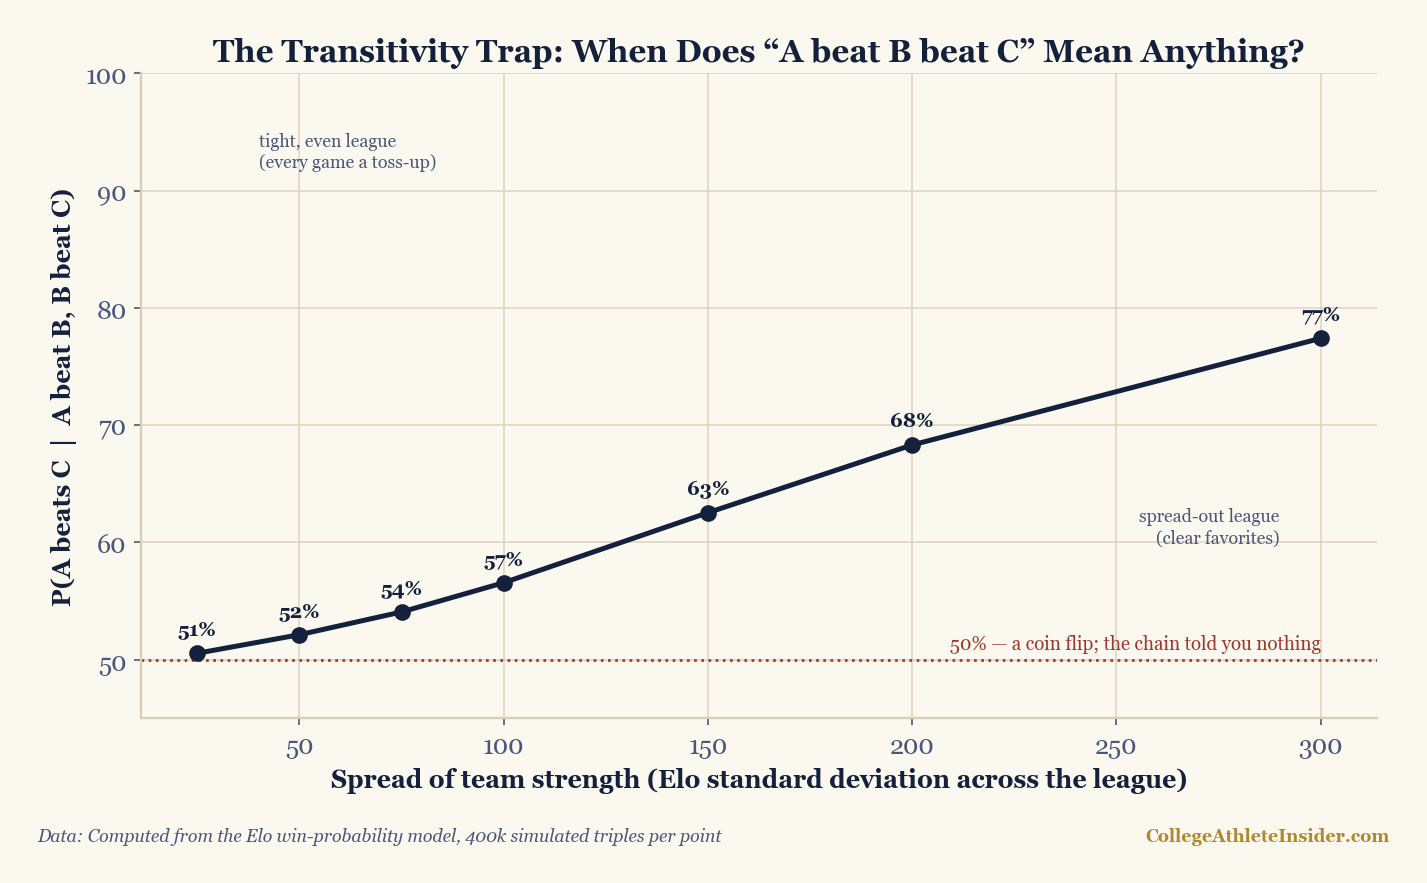
Read the curve left to right. When teams are nearly equal (small strength spread), the conditional probability is 50–52% — the chain told you essentially nothing, because in a coin-flip league A beating B and B beating C are just three independent coin flips that happened to line up. As the league spreads out and real favorites emerge, the chain firms up: 57% at a moderate spread, 68% when gaps are large, and only near 77% in a league of true haves and have-nots. Even at its best, “A beat B beat C” never gets you close to certainty.
A worked example
Picture three roughly even top-25 teams. A edged B by a field goal; B edged C in overtime. The transitive fan concludes A > C. But each of those games was close to a coin flip to begin with, and conditioning on the two you happened to observe barely tilts the third. The model puts A’s chance of beating C at about 53–55% — a hair better than even, nowhere near the slam dunk the chain implies. Now picture a powerhouse, a middling team, and a doormat: A crushed B, B handled C. Here the chain is informative, because the gaps are real and luck rarely overturns them — A beats C perhaps 75% of the time. The same chain of results means very different things depending on how far apart the teams truly are, and at the top of college football, where the contenders are bunched, it usually means very little. This is the same regression-to-the-mean lesson behind strength of schedule and small-sample noise: one or two results are thin evidence.
Why the chain is so weak at the top
The cruel irony is that the transitive argument is invoked most exactly where it works least — among elite teams jockeying for a playoff spot. Those teams are, by definition, close in strength, so every game between them is near a coin flip, and a coin flip carries almost no information about a third coin flip. The wider the field you chain across, the more the noise compounds, too: a five-team chain (“we beat the team that beat the team that beat the team that beat the champ”) is almost pure static. Result chains are seductive because they tell a clean story; they're weak because each link multiplies the uncertainty of the last.
The honest caveats
- This is a model, not a season. The numbers come from simulated teams under the Elo win-probability curve, not a database of real chains — the point is the mechanism and its size, both of which match what rating systems find in practice.
- It assumes one stable strength per team. Real teams change week to week (injuries, improvement), which can make a specific chain more or less meaningful than the average.
- Home field and matchups are ignored. A real A-vs-C game has its own venue and stylistic edges the model leaves out; those can swing an individual case either way.
- One chain, not many. If A beats several teams that all beat C, that's genuinely stronger evidence — the trap is reading too much into a single thread.
The takeaway
“We beat the team that beat them” is the most popular bad argument in college football. It isn't worthless — in a lopsided league it carries real signal — but among the bunched-up contenders who actually invoke it, a single result chain is barely better than a coin flip. The better the teams and the closer the race, the less a chain of results can tell you, which is exactly why we play the games instead of computing the bracket from who-beat-whom. For how the rating systems handle this properly, see net rankings and the overtime math that decides so many of these coin-flip games.
Reproduce it
The simulation is in charts/chart_transitivity.py: draw three team strengths from a normal of width σ, decide each pairwise game with the Elo win probability, keep the triples where A beat B and B beat C, and measure how often A beat C. Sweep σ from a tight league to a spread-out one and plot the curve. Computed from the model; no real game data, nothing hand-entered.
Sources & further reading
- Chapter 18: Game Outcome Prediction, DataField.dev.
- Transitivity probabilities are computed by
charts/chart_transitivity.py(Elo win-probability model, 400,000 simulated triples per point) — not game data. - Related: how net rankings work, strength of schedule, and why small samples mislead.
- Background: building an Elo rating in Python — the win-probability curve behind this model.