Ohio State lost two games in the 2024 regular season, and both times I heard the same thing: the Buckeyes were frauds, a bought roster that folded when it mattered. Then they won the national championship. I want to reconcile those two facts with the least glamorous number in football — yards per play — because it turns out the two losses were not a team collapsing. They were a title team playing its two closest games at the line of scrimmage, and one of them losing anyway despite winning the yards. That last part is the whole point of this piece: yards per play tells you who was better on the vast majority of Saturdays, and then reminds you, once, that better does not mean winner.
Everything below comes from the real ESPN box scores of all twelve of Ohio State's 2024 regular-season games, pulled from the public API and cached. Yards per play is the plainest efficiency stat there is — total yards divided by total plays (rushes plus pass attempts) — and I computed it for the Buckeye offense and for each opponent, every week. No model, no adjustment. Just the box scores.
The season, one row at a time
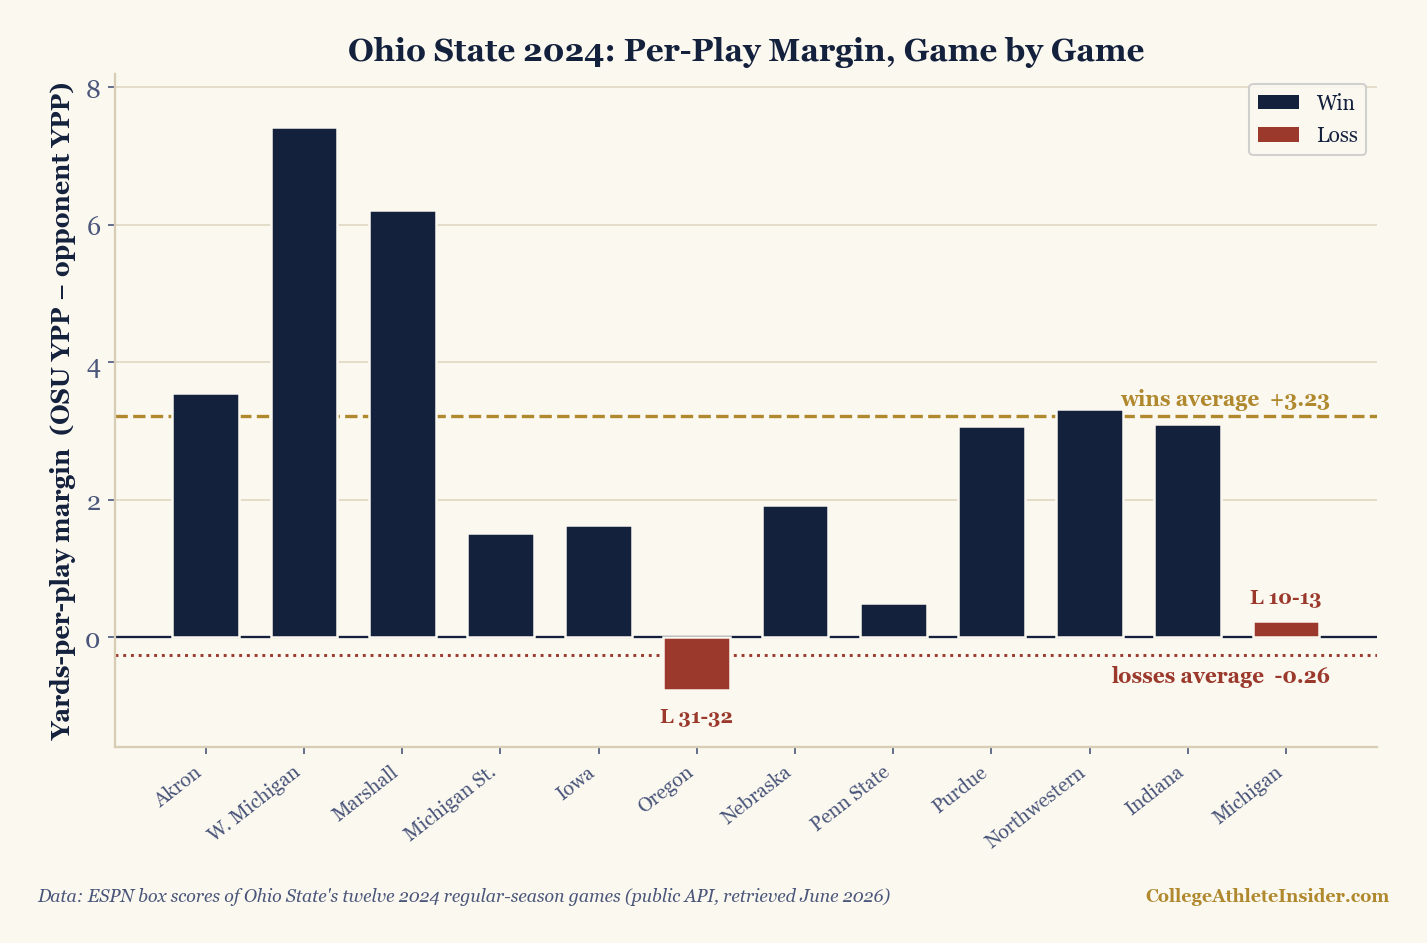
Here is the whole season. “OSU YPP” is what the Buckeye offense averaged per play; “Opp YPP” is what the defense allowed; the margin is the difference, which is the single number I trust most in this table.
| Opponent | Score | OSU YPP | Opp YPP | Margin | Result |
|---|---|---|---|---|---|
| Akron | 52–6 | 6.31 | 2.77 | +3.55 | W |
| Western Michigan | 56–0 | 9.49 | 2.06 | +7.42 | W |
| Marshall | 49–14 | 9.98 | 3.77 | +6.21 | W |
| Michigan State | 38–7 | 6.44 | 4.92 | +1.52 | W |
| Iowa | 35–7 | 6.34 | 4.71 | +1.63 | W |
| Oregon | 31–32 | 6.87 | 7.63 | −0.76 | L |
| Nebraska | 21–17 | 6.06 | 4.14 | +1.93 | W |
| Penn State | 20–13 | 5.59 | 5.09 | +0.50 | W |
| Purdue | 45–0 | 6.56 | 3.49 | +3.07 | W |
| Northwestern | 31–7 | 7.37 | 4.05 | +3.32 | W |
| Indiana | 38–15 | 5.75 | 2.64 | +3.11 | W |
| Michigan | 10–13 | 4.27 | 4.03 | +0.24 | L |
Read the margin column top to bottom and the season organizes itself. Ohio State out-gained every single opponent per play except one — Oregon, and only by three-quarters of a yard. The offense averaged 6.75 yards a play on the year; the defense allowed 4.11. That is a gap of roughly two and a half yards every snap, sustained across a season, which is the statistical signature of a team that is simply better than what it is playing. The Buckeyes outscored those twelve opponents 426 to 131. Nobody who looked at the per-play numbers should have been surprised by what happened in January.
The two losses were the two closest games at the line
Now sort the twelve games by margin instead of by date. The three tightest per-play games of the season were Oregon (−0.76), Michigan (+0.24), and Penn State (+0.50). Two of those three were the losses. That is the honest, useful version of yards per play: it did not call the Buckeyes frauds, and it did not pretend the losses were flukes out of nowhere. It said, correctly, that Ohio State's two defeats came in the two games where its usual per-play cushion nearly vanished. When you win by two and a half yards a snap you win comfortably; when the margin collapses toward zero, the game becomes a coin flip, and coin flips fall both ways.
Averaged out, Ohio State's ten wins came at a per-play margin of +3.23. Its two losses came at a margin of −0.26. The stat separated the winning from the losing almost perfectly — almost.
The Michigan game, where the number lies
Look again at the last row. Against Michigan, Ohio State won the yards-per-play battle — 4.27 to 4.03 — and lost the game, 13–10. That single row is why I never let anyone hand me yards per play as a verdict instead of a description. The Buckeyes moved the ball slightly better than Michigan on a miserable, low-efficiency afternoon and still walked off the field beaten. The yards were positive; the scoreboard was not.
What happened in the gap between those two facts is everything yards per play cannot see. It does not know down and distance, so it cannot tell you a five-yard gain on third-and-eight failed while a four-yard gain on third-and-three worked — the difference between staying on schedule and punting, which is the whole idea behind success rate and EPA. It does not know the red zone, where Ohio State's yards died without becoming points. And above all it does not know turnovers, the great disconnector between how you moved the ball and whether you won, and the noisiest thing in the sport — see why turnover margin barely predicts anything. Yards per play is a season-long truth-teller and a single-game liar, and the Michigan game is the cleanest example of the second half of that sentence I have on file.
What the stat is good for, and what it isn't
I won't oversell one team's twelve rows. The caveats, plainly:
- Schedule is doing some of the work. The three fattest margins — Akron, Western Michigan, Marshall — came against overmatched non-conference opponents in September. Raw yards per play rewards a soft slate exactly the way raw everything does, which is why serious ratings adjust for opponent. See why college stats need adjusting. The Big Ten games (Penn State at +0.50, Nebraska at +1.93) are the more honest reading of how good this team actually was snap to snap.
- Per-play isn't per-drive. Yards per play treats a checkdown and a chunk gain as separate events; it doesn't care how a possession ended. Possession-based efficiency — points per drive and drive-finishing — catches the red-zone failures that sank the Michigan game, which yards per play sailed right past.
- It blends explosiveness and consistency into one number. A team that hits a few 60-yard plays and stalls the rest of the time can post the same average as a team that grinds out six yards a snap, and those are very different offenses. Splitting the two — success rate versus explosiveness — tells you which kind you're looking at.
- Twelve games is twelve games. The +3.23-versus-−0.26 split is a clean story, but it is one season of one team. The claim isn't “yards-per-play margin wins you the specific game” — the Michigan row disproves that. The claim is that it describes, better than the won-lost record does, how good a team really was.
The point of the exercise
If you had ranked the country by yards-per-play margin in November instead of by record, Ohio State would have graded as one of the best teams in the sport — a two-loss team that was blowing the doors off nearly everyone at the line of scrimmage. That grade was right, and the playoff proved it. This is exactly the case for reading a team through its underlying per-play numbers rather than its record: the record said two losses and a team that couldn't win the big one, and the yards said a champion having its two worst days. The yards were closer to the truth.
But the Michigan game keeps me honest, and it should keep you honest too. On any given Saturday the team that moved the ball better can still lose — to a turnover, a missed kick, a red-zone stall — and no efficiency stat will have seen it coming, because those are the parts of football that don't repeat. Yards per play is the best quick read you have on who is better. It is a lousy read on who won. Ohio State's 2024 season is both halves of that lesson in one twelve-row table. For the season-long, luck-adjusted cousin of this idea — how many games a team's underlying play says it should have won — see second-order wins and the Pythagorean expectation, which flagged the Buckeyes as a team that, if anything, underachieved its point margin.
Sources & further reading
- Further reading: Chapter 11: Efficiency Metrics (EPA, Success Rate), DataField.dev.
- ESPN public site API — the real box scores for all twelve of Ohio State's 2024 regular-season games, behind every yards-per-play figure here (retrieved June 2026)
- Bill Connelly, ESPN — SP+ and the marginal-efficiency framework that opponent-adjusts numbers like these (espn.com/college-football)
- CollegeFootballData — collegefootballdata.com, free play-by-play and advanced stats for reproducing per-play and per-drive numbers
- Related: Explosiveness and yards per play · Points per drive · Turnover margin and luck · Second-order wins