Six seconds left, you are up three, the other team has the ball and no timeouts. Do you foul before they can shoot, or do you play straight-up defense and dare them to tie it from deep? Coaches have argued this one for thirty years, and most of them, when the moment actually arrives, do nothing — they defend the arc and pray. I think the math says they are leaving win probability on the floor. Not a lot. But in a spot that decides the season, fouling up three is the higher-percentage play, and the reason is simple: a foul takes the tying three — the one shot that can beat you in regulation — off the table entirely.
Before any numbers, the honest disclosure this site always makes: what follows is a clearly-labelled decision model built on illustrative end-game probabilities, not a database of tracked possessions. Every input below is a stated, reasonable estimate; the arithmetic on those inputs is exact. Change the inputs and the answer moves, and I will show you exactly how much. The point is the structure of the decision, not a claim about any specific team.
The easy branch: don't foul
Play defense and there are two ways the possession ends. Either they miss the tying three and you win, or they make it and you go to overtime. Call the catch-and-shoot three's make probability p, and treat overtime as a coin flip — two evenly matched teams, fresh five minutes. Then:
Win% (don't foul) = (1 − p) × 1 + p × 0.50
A good late-game three goes in around 35% of the time in that spot. Plug it in: (0.65)(1) + (0.35)(0.50) = 0.825. Defending the shot wins you about 82.5% of the time. That already sounds high, and it is why coaches feel safe doing it. But watch what fouling does.
The hard branch: foul, and take the three away
Foul before the shot with a few seconds on the clock and the opponent, down three, goes to the line for two free throws. They cannot tie with two free throws — the best they can do is cut it to one and then need the ball back. Let their free-throw shooter hit at f = 70%, an ordinary clip. The possession now forks three ways:
- Makes both (probability 0.70 × 0.70 = 0.49): the lead is down to one, and now you have the ball with the other team forced to foul. You ice it at the line most of the time; call your win probability here 0.85.
- Makes the first, misses the second on purpose (0.70 × 0.30 = 0.21): you are up two, they are chasing a tip-in off their own intentional miss to tie. Give the offensive-rebound-and-tying-putback a generous 15% and send those to overtime; you win the other 85%. Win probability:
(0.85)(1) + (0.15)(0.50) = 0.925. - Misses the first (0.30): now they are still down three with one shot left, needing an intentional miss, an offensive rebound, and a made basket in a heartbeat. You win almost always — call it 0.95.
Weight each branch by how often it happens and add them up:
Win% (foul) = (0.49)(0.85) + (0.21)(0.925) + (0.30)(0.95)
= 0.416 + 0.194 + 0.285 = 0.896
Fouling wins about 89.6% of the time. Against 82.5% for defending the shot, that is a seven-point swing in win probability — and it comes almost entirely from one place: you deleted the only outcome that beats you in regulation. There is no tying three in the foul branch. The trailing team has to string together multiple unlikely events instead of hitting one catch-and-shoot look.
The sensitivity check, because the inputs are debatable
The one number that decides everything on the don't-foul side is the three-point make probability. So test it:
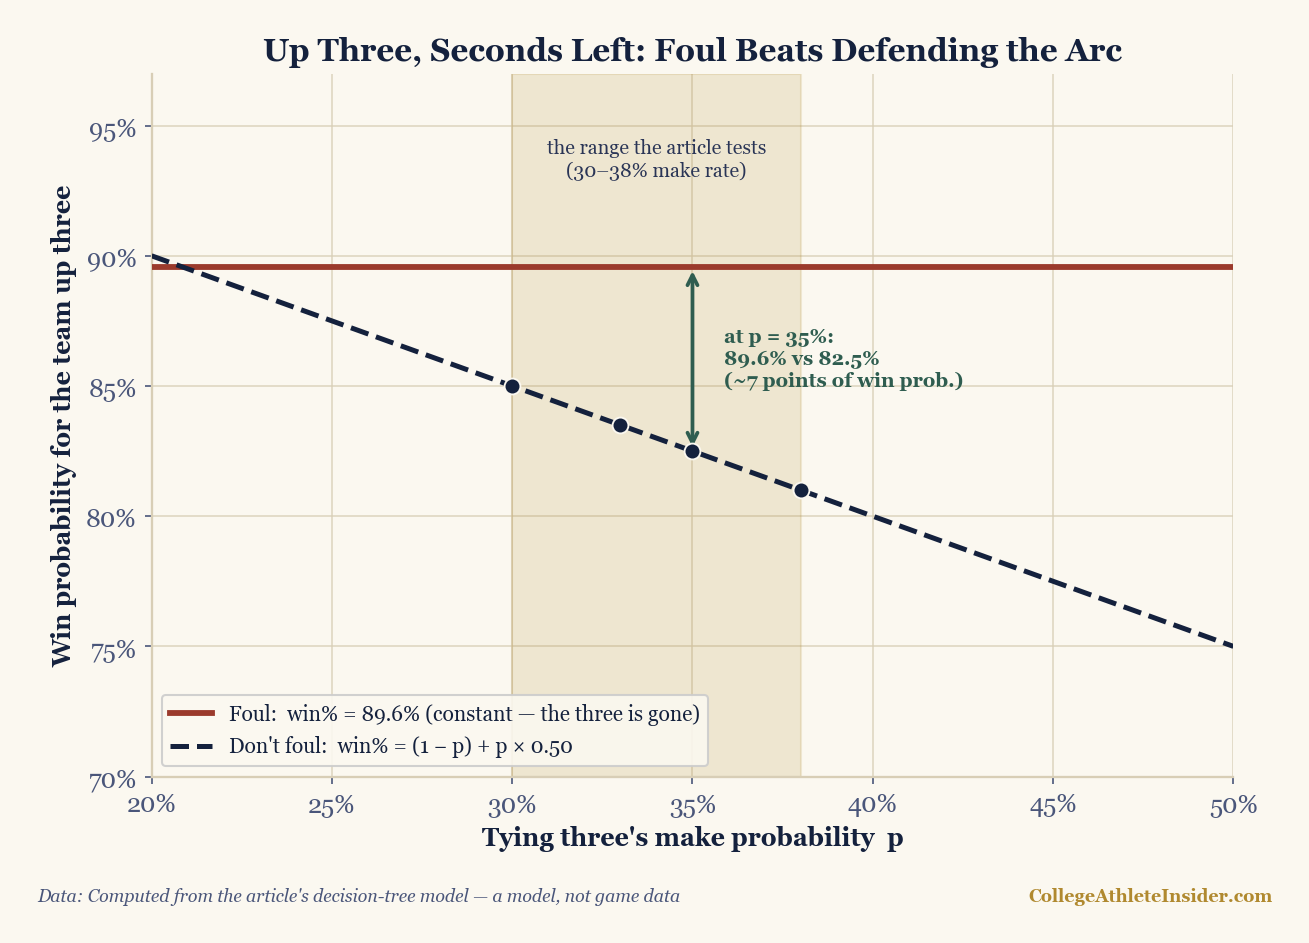
| Tying 3 make rate | Win% (don't foul) | Win% (foul) | Better play |
|---|---|---|---|
| 30% | 85.0% | 89.6% | Foul |
| 33% | 83.5% | 89.6% | Foul |
| 35% | 82.5% | 89.6% | Foul |
| 38% | 81.0% | 89.6% | Foul |
Across the whole plausible range for a late three, fouling stays ahead. Even if you think the shooter is stone-cold at 30%, defending only gets you to 85%, still short of fouling. You would have to believe the tying three almost never goes in and disbelieve the foul branch's numbers to flip the decision. The model is not close to a coin flip; it leans one way.
So why won't coaches do it?
Because the model above quietly assumes the foul goes cleanly — caught in the backcourt, well before the shooter gathers, with enough clock that a made second free throw doesn't hand the offense a putback in the last tick. Real fouls are messy, and the caveats are exactly where the resistance lives:
- Fouling a jump shooter is a catastrophe. Time the foul a half-second late, catch a player in the act of shooting a three, and you have given up three free throws to tie — or a four-point play. That tail risk is small in probability and enormous in consequence, and it is the single biggest reason coaches flinch.
- Clock and timeouts change the tree. With one second left, there is no time to foul; with the offense holding timeouts, a made-and-missed free throw sequence can be advanced and re-set, feeding branches my simple tree ignores. The seven-point edge assumes a specific, common situation — a few seconds, no offensive timeouts — not every situation.
- The inputs are illustrative. The 85%, 92.5%, and 95% terminal win probabilities in the foul branch are reasonable estimates, not measured constants. Shade them all pessimistic and the foul edge narrows; it does not obviously vanish, but it is not carved in stone.
- Blame asymmetry is real. A coach who defends and loses on a great shot “played it straight.” A coach who fouls and loses on a broken sequence “coached his team out of the game.” The win-probability edge is modest; the second-guessing is not symmetric. Humans optimize for regret, not just for probability.
That last point is the honest reconciliation. Fouling is the higher-percentage play in the clean case, and the edge survives a fair range of assumptions — but it is a modest edge bought at the price of a rare, disastrous downside and a lot of second-guessing. Rational coaches weigh the tail and the blame, not just the mean. The math says foul; the incentives say don't; and that gap, not any arithmetic error, is why you still see teams defend the arc.
The same logic, everywhere
This is expected-value decision-making, the same machinery as kick-or-go-for-two and fourth-down calls on the football side: enumerate the outcomes, weight them by probability, and take the branch with the higher win probability rather than the one that feels safe. It also rhymes with why underdogs shorten games — both are about controlling which random outcomes are even allowed to happen. Fouling up three is just the cleanest example I know of a play where removing your opponent's best option beats defending it. If you want to feel how thin some of these edges are, the calculators hub lets you push win-probability inputs around and watch the recommended decision flip.
Up three, ball in the other team's hands, seconds left: the numbers say put them on the line. Most coaches won't. Now you know both why the math wants it and why the bench doesn't.
Sources & further reading
- Background: Chapter 8: Probability: The Foundation of Inference (DataField.dev).
- Ken Pomeroy, kenpom.com — among the analysts who have studied fouling up three from tracked end-game possessions; the direction of this piece matches that public work
- The decision tree and every percentage here are computed by hand from the stated illustrative inputs — a labelled model, not tracked game data
- Dean Oliver, Basketball on Paper (2004) — the possession-based, expected-value way of thinking that underlies end-game decisions
- Related: Kick or go for two · Fourth-down decisions · Why underdogs slow the game down · Bracket math and upset odds