Yards are the currency everyone quotes and almost nobody should. A 3-yard gain on 3rd-and-2 wins the down; a 6-yard gain on 3rd-and-10 loses it. Yards can't tell those apart. Two stats can: success rate and expected points added (EPA). They're the backbone of modern football analysis, and you can compute the first one with nothing but a play-by-play sheet and a calculator. Let's do exactly that, using a real game.
Success rate: the 50-70-100 rule
A play is "successful" if it gains enough to keep an offense on schedule. The standard thresholds, used across the analytics world:
- 1st down: gain at least 50% of the yards to go.
- 2nd down: gain at least 70% of the yards to go.
- 3rd or 4th down: gain 100% — convert, or it's a failure.
That's the whole definition. Success rate is just the share of a team's plays that clear the bar. It rewards staying ahead of the chains and ignores empty yards. A defense's job is to drive that number down.
Compute it by hand from a real drive
Here is one actual Michigan drive from the January 1, 2024 Rose Bowl — the College Football Playoff semifinal against Alabama — scored play by play with the rule above (the script that pulls this is scripts/success-rate-epa-explained.py):
| Down | To go | Gain | Success? |
|---|---|---|---|
| 1 | 10 | +8 | Yes |
| 2 | 2 | +4 | Yes |
| 1 | 10 | +2 | No |
| 2 | 8 | +11 | Yes |
| 1 | 10 | +20 | Yes |
| 1 | 10 | +0 | No |
| 2 | 10 | +0 | No |
| 3 | 10 | +38 | Yes |
Five of the eight snaps clear the bar — six, actually, counting the conversion: that's a 75% success rate on this drive. Look at the 2nd-and-2: a 4-yard gain is unspectacular, but it needed only 1.4 yards to succeed, so it counts. Meanwhile the +0 on 1st-and-10 fails despite "staying on first down" in box-score terms. The stat sees the difference; yards don't.
Now the whole game
Run that calculation over every snap and you get a clean summary of who controlled downs. Across the full Rose Bowl:
Alabama was the more efficient offense on a per-play basis (27 successful plays of 66, to Michigan's 22 of 59) — yet Michigan won in overtime. That gap between efficiency and result is exactly why analysts love these numbers and why they never use them alone: success rate measures process, not the scoreboard.
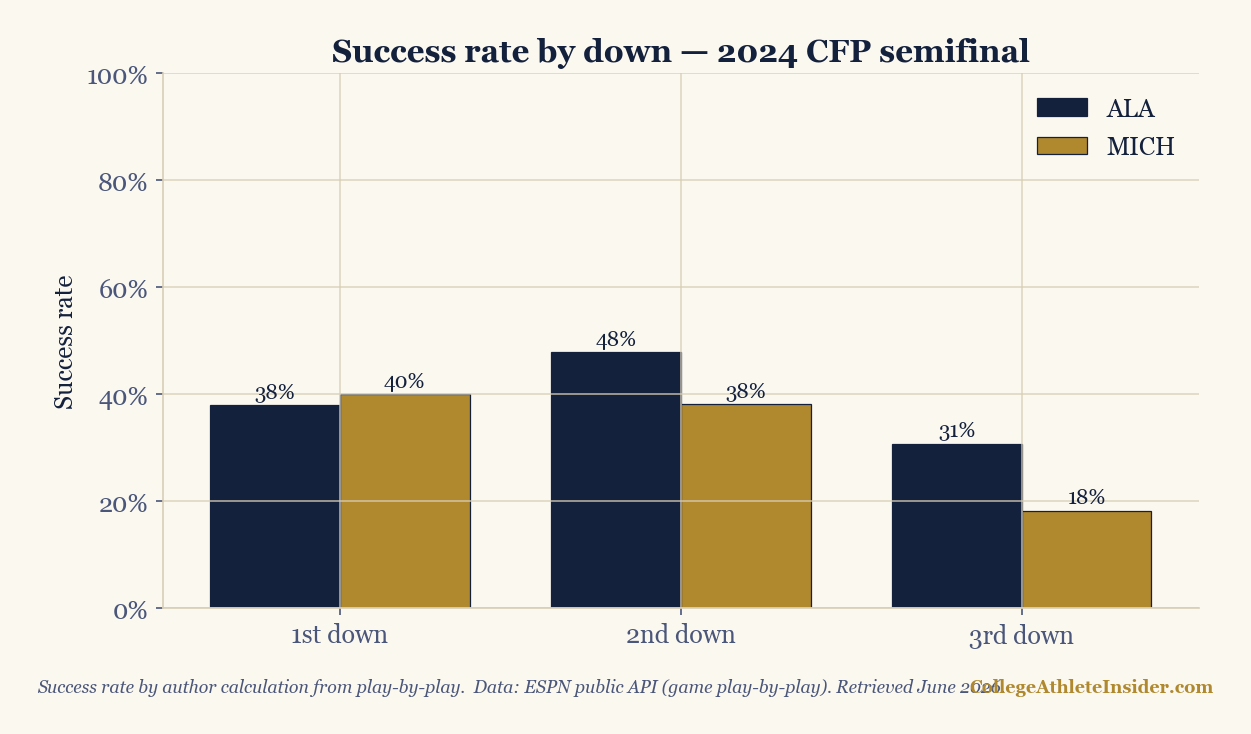
That third-down collapse is normal: 3rd down demands 100% of the distance, so the bar is highest exactly when it's hardest to clear. It's why "get off the field on third down" and "stay out of third-and-long" are the two oldest truths in the sport, now with a number attached.
EPA: putting a point value on a play
Success rate is binary — a play either clears the bar or it doesn't. Expected points added adds magnitude. The idea: every situation (down, distance, field position) has an expected points value, learned from thousands of historical drives — how many points the offense will, on average, eventually score from there. EPA is simply the change in that value from one snap to the next.
Take a 1st-and-10 at your own 25, worth perhaps +1.0 expected points. Rip off a 40-yard gain to the opponent's 35, now worth maybe +3.0, and the play earned about +2.0 EPA. A sack that pushes you back, or an interception, produces large negative EPA. Where success rate says "yes or no," EPA says "by how much" — so an explosive 40-yard run and a grind-it-out 3-yard conversion both succeed, but the long one adds far more EPA.
Used together they describe a team completely: success rate is consistency, EPA per play is consistency plus explosiveness. A team can be efficient but not explosive (lots of 5-yard gains, few chunk plays) or the reverse. The building blocks of ratings like SP+ are made of exactly these two measurements.
How to use them
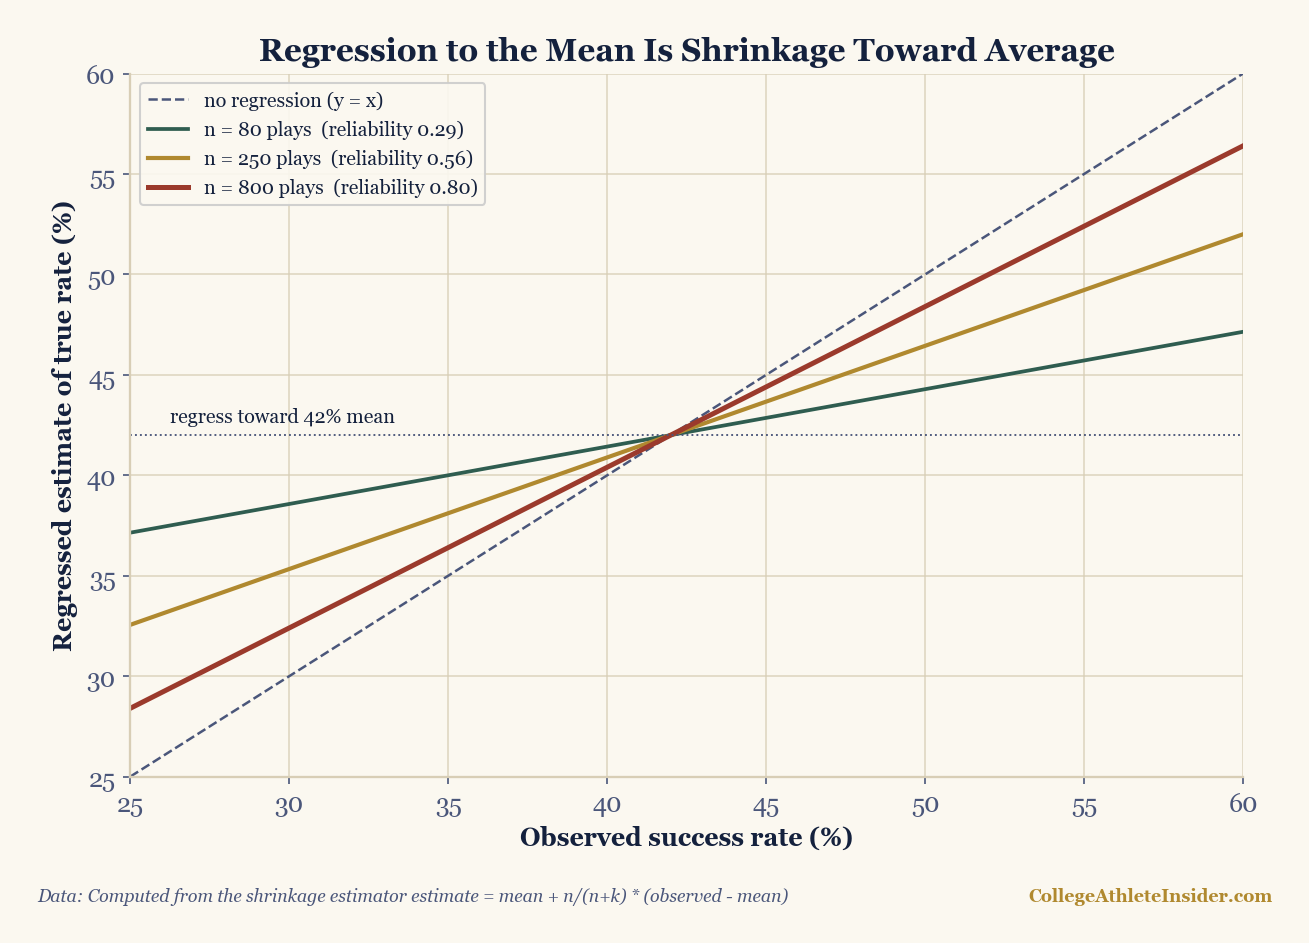
When you hear a team is "due for regression," check whether its record outran its success rate and EPA. When a quarterback "puts up numbers" in losses, see whether the efficiency was real or padded in garbage time. These two stats won't tell you who won. They'll tell you who played well — which, over a season, is the better guide to who'll win next.
Try it yourself
Put the formula from this piece to work on your own numbers. It runs entirely in your browser — nothing is sent anywhere. For the full set, see the Calculators hub.
Was the play a success?
Classify a single play by the standard success-rate rule: a play succeeds if it gains ≥50% of the distance on 1st down, ≥70% on 2nd, and 100% on 3rd or 4th.
Pure math on the numbers you enter. Nothing is fetched and no real team, player, or result is named or invented.
Success rate over a set of plays
Paste a list of plays and get the offense's success rate — the share of plays that stayed on schedule by the down-and-distance rule.
Pure math on the numbers you enter. Nothing is fetched and no real team, player, or result is named or invented.
Sources & further reading
- Free textbook: Chapter 11: Efficiency Metrics (EPA, Success Rate) — the theory behind this, at DataField.dev.
- ESPN public play-by-play (game summaries) — used for the worked example
- CollegeFootballData.com — collegefootballdata.com (season EPA and success-rate data)
- Related: How SP+ and adjusted efficiency work