Points per game is the most quoted offensive stat in college football and one of the most misleading. Two offenses can score the identical 35 a game and be nowhere near equal, because one did it on nine possessions and the other on thirteen. Per-game scoring rewards an offense for running a lot of plays as much as for being any good at them, which means it secretly measures tempo as much as quality. The cleaner question — the one that actually ranks offenses fairly — isn't how many points you score in a game. It's how many points you score per possession. That single change of denominator fixes most of what's wrong with how scoring is reported.
The one-sentence version: points per drive divides scoring by opportunities instead of by games, which strips out pace and finally puts a fast, play-heavy offense and a slow, ball-control offense on the same ruler — the ruler points per game refuses to use.
Why per-game scoring is contaminated by pace
A football game doesn't have a fixed number of plays; it has a roughly fixed number of possessions, and even that varies. An up-tempo offense that snaps the ball every 20 seconds will run far more plays and get more drives than a huddle-and-grind offense that milks the clock — and more drives means more chances to score, regardless of how efficient any single drive is. So when you see "Team A scores 38, Team B scores 31," part of that six-point gap is quality and part of it is simply that Team A had more turns with the ball. Per-game scoring can't separate the two. It rewards the offense that plays faster alongside the offense that plays better, and on a leaderboard those two things end up hopelessly tangled. The same contamination hits defense in reverse: a defense that faces 13 drives a game will allow more points than one facing nine, even if it's stingier on every single possession.
Points per drive: dividing by opportunities
The fix is to change the denominator from games to drives:
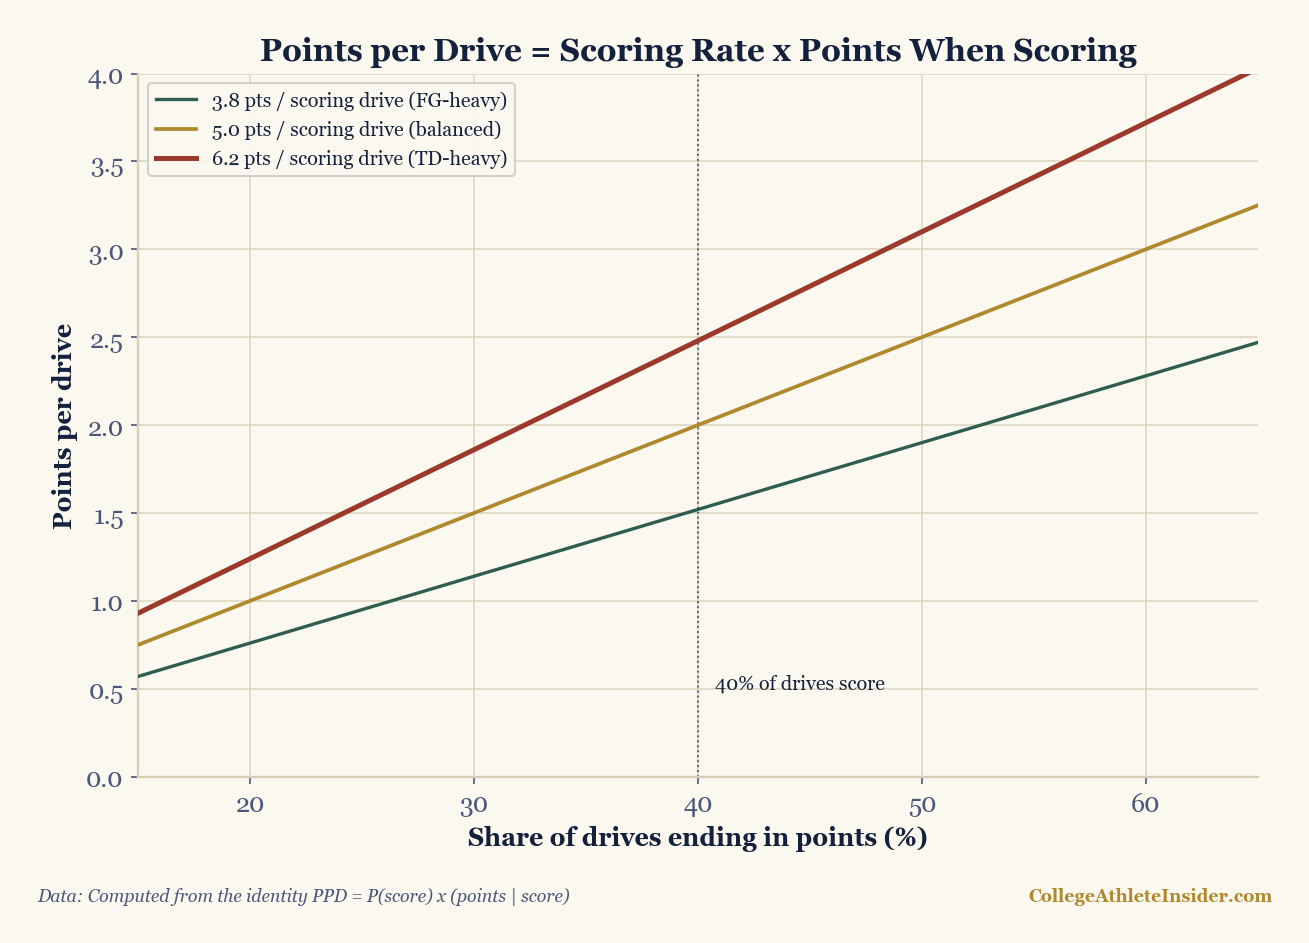
Points per drive = total points scored / total offensive drives
Now both offenses are measured by what they do with each possession, and tempo washes out. The fast team's extra drives are in the denominator, so they no longer inflate the rating — they just have to be used well to help. An offense that scores 35 on nine drives (about 3.9 a drive) is meaningfully better than one that scores 35 on thirteen (about 2.7 a drive), and points per drive says so immediately, where points per game called them even. This is the same logic that makes points per 100 possessions the standard in basketball: you rate the offense per opportunity, not per clock-minute, because opportunities are what scoring actually consumes.
A couple of bookkeeping notes keep it honest. Drives that end a half on a kneel-down or run-out-the-clock aren't real scoring attempts and are usually excluded, as are garbage-time possessions if you're measuring competitive quality. And like any per-possession rate, points per drive is still a raw number until you adjust it for opponent — three points a drive against a porous defense isn't the same as three against an elite one. But even before opponent adjustment, dividing by drives removes the single biggest distortion in per-game scoring.
Available yards and drive-finishing: where the points come from
Points per drive is the headline; two companion measures explain it. The first is available yards: on each drive, the offense starts some distance from the end zone, and "available yards" is the share of that distance it actually covers. Start at your own 25 and you have 75 yards available; reach the opponent's 35 and you gained 40 of those 75, or about 53% of the yards available to you. Average it over a season and available-yards percentage tells you how consistently an offense moves the ball down the field it's given — and crucially, it folds in field position, since an offense that always starts on a short field has fewer available yards to cover and shouldn't get full credit for short scoring drives.
The second is drive-finishing: once an offense reaches scoring range, how many points does it come away with? An offense can move the ball beautifully (high available yards) and still bleed the advantage by settling for field goals or stalling at the 15. Points per drive is, in effect, the product of moving the ball (available yards) and cashing it in (finishing). Splitting them tells you why a points-per-drive number is high or low: a good number built on great available yards but mediocre finishing is a red-zone problem waiting to be fixed; a good number built on short fields and elite finishing might regress if the special teams and defense stop handing the offense good starting spots.
A worked example: same points per game, different points per drive
Take two hypothetical offenses that each average 35 points a game. The figures below are invented to show the contrast, not measured from any real team:
| Offense | Points / game | Drives / game | Points / drive | Available yards |
|---|---|---|---|---|
| Tempo Inc. | 35 | 13 | 2.7 | 48% |
| Grind Co. | 35 | 9 | 3.9 | 61% |
Per game they're twins — both put up 35. Per drive, Grind Co. is comfortably the better offense, squeezing nearly four points out of every possession while Tempo Inc. needs four extra drives a game to reach the same total. If you ranked these two by points per game you'd call it a wash and move on; rank them by points per drive and you'd correctly flag Grind Co. as the more efficient unit and Tempo Inc. as one leaning on volume. The same logic runs the other way for defenses: a defense allowing 24 a game on thirteen possessions is playing better per drive than one allowing 24 on nine. (Again, these figures are made up to illustrate the idea.)
Why it ranks offenses and defenses fairly
The reason analysts reach for points per drive is that it's the rare scoring stat that's pace-neutral on both sides of the ball. Rate an offense per drive and a fast team gets no free credit for its extra snaps; rate a defense per drive and a team that forces three-and-outs (and therefore faces more possessions) isn't punished for the volume its own success creates. That symmetry is what lets you compare a ball-control SEC offense to an Air-Raid sprint without one style flattering itself in the numbers. It also feeds directly into the drive-based rating systems — the family of metrics that grade whole possessions rather than single plays — because once you're working per drive, a team's offense and defense are finally denominated in the same currency: points produced and points prevented, per turn with the ball.
How to use it
- Quote points per drive, not points per game. The first measures how good an offense is; the second measures how good and how fast, tangled together.
- Check the pace before believing a scoring number. A 35-point offense on thirteen drives and one on nine are not the same team — the denominator decides which is better.
- Split moving from finishing. Available yards tells you whether an offense advances the ball; drive-finishing tells you whether it cashes in. Points per drive is roughly their product.
- Watch the field-position confound. An offense fed short fields posts gaudy points per drive without great available yards — credit the special teams and defense, not just the offense.
- Adjust for opponent. Per-drive scoring is still raw until you account for who you played; pair it with strength-of-schedule before ranking anyone.
The next time an offense is "putting up 35 a game," ask the question per-game scoring buries: 35 on how many drives? Points are scored a possession at a time, not a game at a time, and the moment you switch the denominator to match, the leaderboard reorders itself — the tempo merchants slide, the efficient grinders climb, and "good offense" finally means points per opportunity instead of points per clock.
Sources & further reading
- Theory: Chapter 11: Efficiency Metrics (EPA, Success Rate) — a free chapter at DataField.dev.
- CollegeFootballData.com — collegefootballdata.com (drive data; free API key)
- Companion explainer: FEI and drive efficiency
- Related: Tempo in college football · Field position and expected points