When a college football game goes to overtime, the captains meet at midfield for a coin toss — and almost every winning captain says the same thing: we'll play defense. They are choosing to give the other team the ball first. That looks backwards until you understand the format's hidden asymmetry: the team that possesses second knows exactly what it needs to do, and that information is worth real wins. Model the format and the edge is about 56%–44% in favor of the team that goes second — a coin toss that isn't a coin flip at all.
How the format works
College overtime is not the NFL's sudden-death sprint. Each team gets a possession starting at the opponent's 25-yard line; they alternate, and after each full round you compare scores. Score-for-score, you keep going. The rules then add a twist designed to end things: from the third overtime onward, teams no longer run full drives — they alternate two-point conversion attempts from the three until someone misses and the other converts. The whole structure is built around matched, alternating possessions, and that's exactly what hands the second team its advantage.
Where the edge comes from: information
The team with the ball first is playing blind. It doesn't know whether a field goal will be enough or whether it needs a touchdown, so on a fourth-and-3 from the 8 it defaults to the safe play — kick the field goal and put points on the board. The team with the ball second plays with the answer sheet:
- If the first team scored nothing, the second team needs only a field goal to win — so it plays conservatively, gets into range, and kicks. No risk required.
- If the first team kicked a field goal, the second team knows a field goal ties (extend the game) and a touchdown wins — it can take the safe three if the drive stalls, or the seven if it's there.
- If the first team scored a touchdown, the second team knows a field goal is worthless, so it correctly goes for it on fourth down instead of settling. It converts touchdowns it would otherwise have kicked away.
That last case is the crux. The first team, not knowing it needed a touchdown, sometimes “wastes” a possession on a field goal it didn't need; the second team never does. Perfect information lets the trailing-or-tied team match its risk to the situation, and matching risk to situation is the whole game.
The exhibit: modeling the coin toss
To size the edge, we simulate 200,000 overtimes. Each possession from the 25 is modeled with realistic college red-zone rates — a touchdown outright, a drive that stalls into a fourth-down field-goal decision, or no score — and the two teams differ only in information: the first team always kicks at the decision point, while the second team kicks when a field goal is enough and goes for it when only a touchdown will do. (This is a labeled model, not a database of real games; the point is the mechanism and its size.)
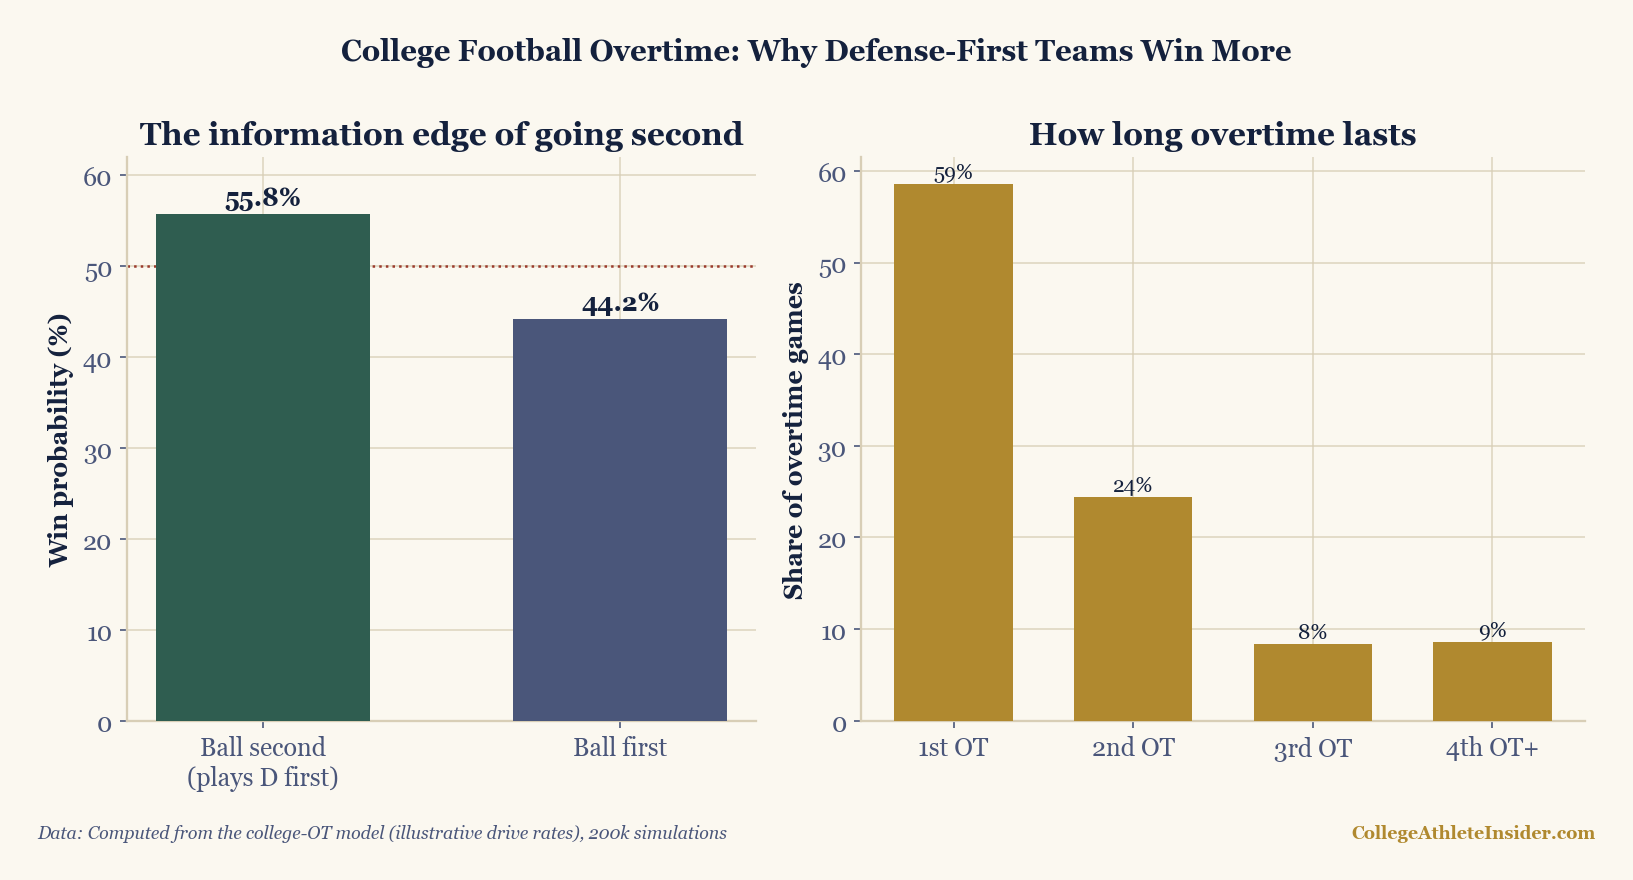
Two things jump out. First, the 5.8-point edge for going second is not subtle — it's larger than the home-field edge in many sports, and it comes entirely from information, not talent. Second, overtime usually ends fast: about 59% of games finish in the first overtime and 83% by the end of the second, but the remaining one-in-six drag into the third-overtime two-point shootout, where the same information edge reappears on every alternating try.
A worked example
Suppose the first team drives and kicks a field goal: 3–0. Now the second team takes over knowing the target is 3. If its drive bogs down at the 10 on fourth down, it kicks the tying field goal and the game continues — no need to gamble. But if the first team had instead scored a touchdown (7–0), that same fourth-and-goal is now a must-go situation, and the second team goes for the touchdown rather than kicking a pointless three. The first team, facing the identical fourth down earlier, didn't have that clarity — it kicked, because for all it knew three points would hold up. Same field position, same odds of converting, completely different correct decision — and only one team gets to make it with the answer in hand. For the underlying fourth-down logic, see my look at fourth-down decision-making and the two-point conversion math that decides the late rounds.
Why the edge isn't bigger
If information is so valuable, why only 56% and not 70%? Because most of the time it doesn't get to matter. When both teams score touchdowns or both kick field goals — the common cases — the round simply resets and the advantage carries to the next one. The edge only “cashes” in the asymmetric rounds, where one team scored and the other faces a clarified decision. Those rounds are a minority, so the advantage compounds slowly across overtimes rather than deciding things outright. It's a thumb on the scale, not a hand — but over a season of overtime games, a thumb on the scale wins championships.
The honest caveats
- This is a model, not a game log. The drive-outcome rates are realistic for college red-zone offense but they're inputs, not measured 2024 data; the direction and rough size of the edge are the robust findings, and they match the real-world record (teams going second have historically won a bit over half).
- Teams aren't identical. We gave both sides the same offense to isolate the information effect. A great offense against a weak defense changes the picture — the edge is what you'd add on top of the talent gap.
- The two-point era is new. The from-the-third-overtime two-point shootout (adopted in 2021) is still a small sample in reality; our model assumes a fixed conversion rate, but real two-point rates vary by team and situation.
- Coaching isn't always optimal. The model assumes the second team always makes the textbook kick-or-go choice. Real coaches sometimes don't, which would shrink the edge.
The takeaway
The overtime coin toss looks like luck and plays like strategy. Winning it and choosing to go second buys you the one thing the format won't give the other team: certainty about what you need before you need to do it. The model puts that certainty at almost six percentage points of win probability — reason enough that you'll almost never see a college captain win the toss and choose to take the ball first. For more on reading these end-game situations, see when a lead is safe and how win probability models work.
Reproduce it
The simulation is in charts/chart_overtime_cfb.py: each possession draws an outcome from the stated drive rates, the second team's kick-or-go choice depends on the first team's score, and from the third overtime the teams alternate two-point tries. Run it over 200,000 overtimes and count how often the second team wins. Change the drive rates at the top of the file and the edge moves — but as long as the second team optimizes and the first defaults, the second team comes out ahead. Computed from the model; no real game data, nothing hand-entered.
Sources & further reading
- Chapter 21: Win Probability Models, DataField.dev.
- Overtime win probability is computed by the model in
charts/chart_overtime_cfb.py(illustrative drive rates, 200,000 simulations) — not game data. - Related: how win probability models work, when a lead is safe, and the two-point conversion math that decides the late rounds.
- Background: fourth-down decision-making — the kick-or-go logic the second team exploits.