A preseason poll is a guess. A well-informed guess — voters weigh returning starters, recruiting, coaching, last year’s film — but a guess made before a single snap. In the language of statistics it’s a prior: a belief you hold before the evidence arrives. Then the season starts, and every game is evidence. The question I care about is how fast that evidence should outweigh the guess, and there’s a clean answer. Bayesian updating says the season’s results overtake the preseason poll sooner than the polls themselves admit. My position, stated plainly up front: voters anchor on the preseason ranking far too long, and the math says so.
One thing before the numbers, because the recent pieces on this site have all been honest about it: what follows is a clearly-labelled model, computed from a Bayesian updating model, not a database of poll movements. I’m showing you how a rational observer should reweight a prior as games pile up. That’s a normative claim, and I’ll be careful to keep it separate from what voters actually do.
The model in one line
Treat the preseason poll as worth k “virtual games” of information — as if, before the season, you’d already watched the team play k times. After n real games, your best estimate is a weighted average of the two sources, and the weights are just the counts. The weight on the season’s results is n / (k + n); the weight on the poll is k / (k + n). That’s the whole apparatus. The results outweigh the poll the moment n passes k, and the 50% crossover sits exactly at n = k.
The exhibit
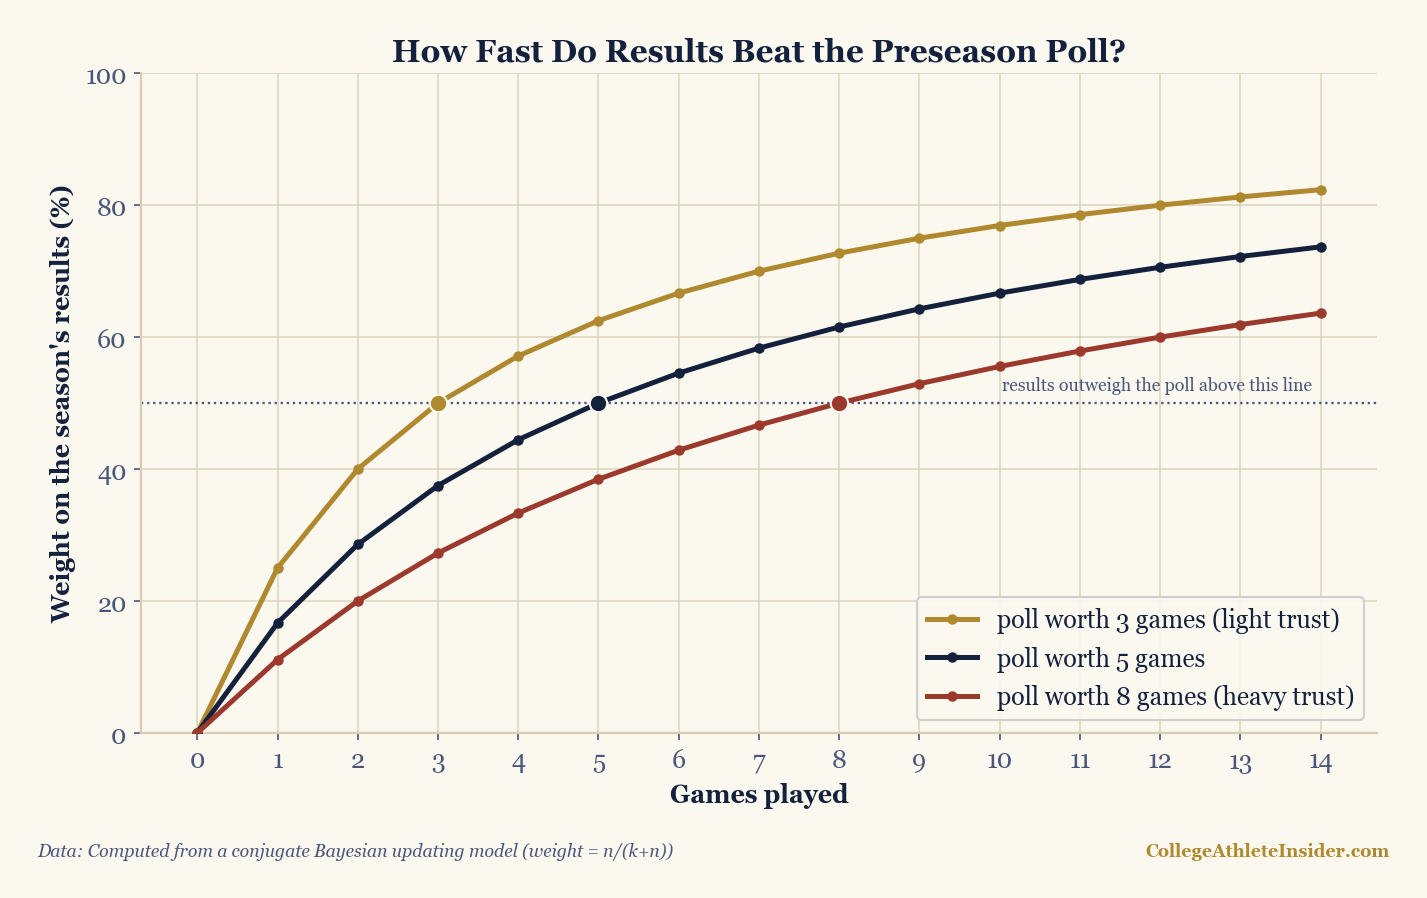
Read the curves by trust level. If you give the poll moderate trust — worth k = 5 games — the season’s results hit 50% of the weight at n = 5 games, climb to 64% by nine games, and reach 71% by the end of a twelve-game regular season. Put another way, by season’s end the preseason poll is down to about 29% of your estimate. Trust the poll only lightly (k = 3) and the crossover comes at just three games. Even trust it heavily (k = 8) and the results still pull ahead: 53% at nine games, 60% at twelve. The headline I’d hang on this: under moderate trust, the season’s results outweigh the preseason poll after about five games — roughly early October — yet voters routinely keep top-five preseason teams parked near the top long after that.
Worked through, slowly
Take the moderate case, k = 5, and walk the season. After five games the weight on results is 5 / (5 + 5) = 0.50 — a dead tie between what you guessed and what you’ve seen. After nine games it’s 9 / (5 + 9) = 9/14 = 0.64. After twelve, 12 / (5 + 12) = 12/17 = 0.71. The arithmetic really is that plain; there’s no hidden machinery.
What does “the poll is worth five games” actually mean? It means the preseason guess is about as informative as having watched the team play five times. That’s the beautiful trick of treating a prior as virtual observations: it puts the guess and the games on the same scale, so combining them is just bookkeeping. Your posterior estimate is the weighted average (prior × k + results × n) / (k + n) — the prior counts for k games, the season counts for its n, and you divide by the total. Early on, when n is tiny, the prior dominates because it’s the biggest pile of “games” you have. As real games accumulate they swamp it. That’s not a quirk of football; it’s how conjugate priors behave everywhere.
Where this is too tidy
I won’t pretend the model is the territory. The honest caveats matter as much as the result.
kis an assumption, not a measurement. How good preseason polls truly are is debatable, and a well-built preseason model — one leaning on returning production and recruiting — might genuinely be worth more than five games, especially in September when every team’s sample is microscopic. Setktoo low and you’ll overreact to noise; too high and you’ll anchor like a poll voter. The choice ofkis the whole argument.- Not every game is equally informative. The model treats all
ngames as identical evidence, but a 49–3 win over a cupcake tells you almost nothing, while a road loss to a ranked team tells you plenty. Strength of schedule belongs insiden, and this version ignores it — see strength of schedule for why the opponent matters as much as the result. - Results are noisy in the other direction. The opposite error to anchoring is overreacting — a 3–0 start against weak teams isn’t proof of a playoff team, just as a fluky 1–2 start isn’t proof of collapse. Early records mislead too, which is the same small-sample lesson behind why a few carries can’t pin down a rushing average. The model corrects anchoring; it doesn’t license credulity.
- This is how you should update, not how voters do. The curves are a yardstick for rational reweighting. The gap between them and the actual poll movement is precisely my complaint, not a description of it.
Where the idea comes from
The engine here is Bayesian updating, and specifically the conjugate-prior trick of expressing a prior as a number of virtual observations — the cleanest way to make “a prior worth k games” literal. It’s the same responsiveness dial that shows up in rating systems: a low k here is a fast-moving rating, and a high k is a sticky one, which is exactly the tension I unpacked in the K-factor and rating responsiveness. The empirical backstop is real, too: preseason rankings stay predictive surprisingly far into the season, largely because the things that drive them — returning production chief among them — are genuinely sticky year to year. That’s the honest case for a non-trivial k. It’s also why I land on “voters anchor too long” rather than “ignore the poll” — the prior earns its early weight; it just shouldn’t keep it.
Reproduce it
There’s nothing to hand-enter. The weight on results is weight = n / (k + n), plotted across a season for several values of k, and the figure is regenerated by charts/chart_prior_vs_data.py. Change k, change the season length, and the crossover moves to n = k every time. If you’d rather watch the same updating logic run inside an actual rating, the Elo and rating tools on the calculators page are the same machinery with the dial set for you.
The takeaway
A preseason poll deserves real weight in week one and almost none by November — and the handoff happens faster than the rankings act like it does. Under moderate trust the season takes over after about five games; even under heavy trust it wins out before the season’s halfway home. The poll was a fine prior. The games are the evidence. Let the evidence win on schedule.
Sources & further reading
- Chapter 9: Conditional Probability and Bayes’ Theorem, DataField.dev.
- The weight curves are computed by
charts/chart_prior_vs_data.pyfromweight = n / (k + n)for k = 3, 5, and 8 — a labelled Bayesian model, not game data. - Background: the conjugate-prior idea of treating a prior as k virtual observations is standard Bayesian updating — any introductory Bayesian text (or the chapter above) covers the prior-as-pseudocount construction used here.
- Related: why returning production stays predictive, the K-factor and how fast a rating should move, and strength of schedule — the context the model leaves out.