On the evening of October 12, Georgia Southern had scored three points in three quarters and trailed Marshall 23–3. The fourth quarter went 21–0 the other way, and the Eagles won 24–23 — the largest deficit at the third-quarter gun that any team erased all season. Every broadcast has a version of the sentence that game seems to prove: anything can happen in the fourth quarter. This article is about how the sentence is mostly a lie — and about the narrow band where it’s true. Across the 877 completed 2024 games in this site’s cache, the team leading after three quarters won 87.1% of the time. Ahead by more than two scores, it won 353 of 358 (98.6%). Ahead by 25 or more, it went 189 for 189. The fourth quarter’s other reputation — “garbage time,” when losers pad numbers against emptied benches — fails the audit too, in the opposite direction: in games already decided by 17+ entering the fourth, the leading team outscored the trailing team 8.0 to 4.9. The fourth quarter is not a lottery. It is a ratification ceremony with a one-score exception clause — and the exception clause covers just over a third of the sport.
What counts here
Same dataset as the margin-distribution census and the overtime census: my locally cached ESPN scoreboard responses — 877 completed 2024 college football games, August 24 through December 21 kickoffs (retrieved June 2026), regular season through three of the four CFP first-round games. The quarterfinals onward and the January bowls are not in the cache, so nothing here speaks to them. The feed’s per-quarter linescores are the whole instrument: they give each team’s score at the end of every period, they sum to the final in all 877 games (the build audits this), and they define the checkpoint everything below uses — the scoreboard at the moment the third quarter ends. One honest limitation before any number: linescores see quarter boundaries only. A lead that changed hands four times inside the fourth quarter, or a 24-point mid-third-quarter hole that was half-filled by the gun, is invisible here. This is a census of Q3-boundary leads and final results, nothing finer. Dates in prose are the cached kickoffs converted to U.S. Eastern.
The census: 834 leaders, 726 holds
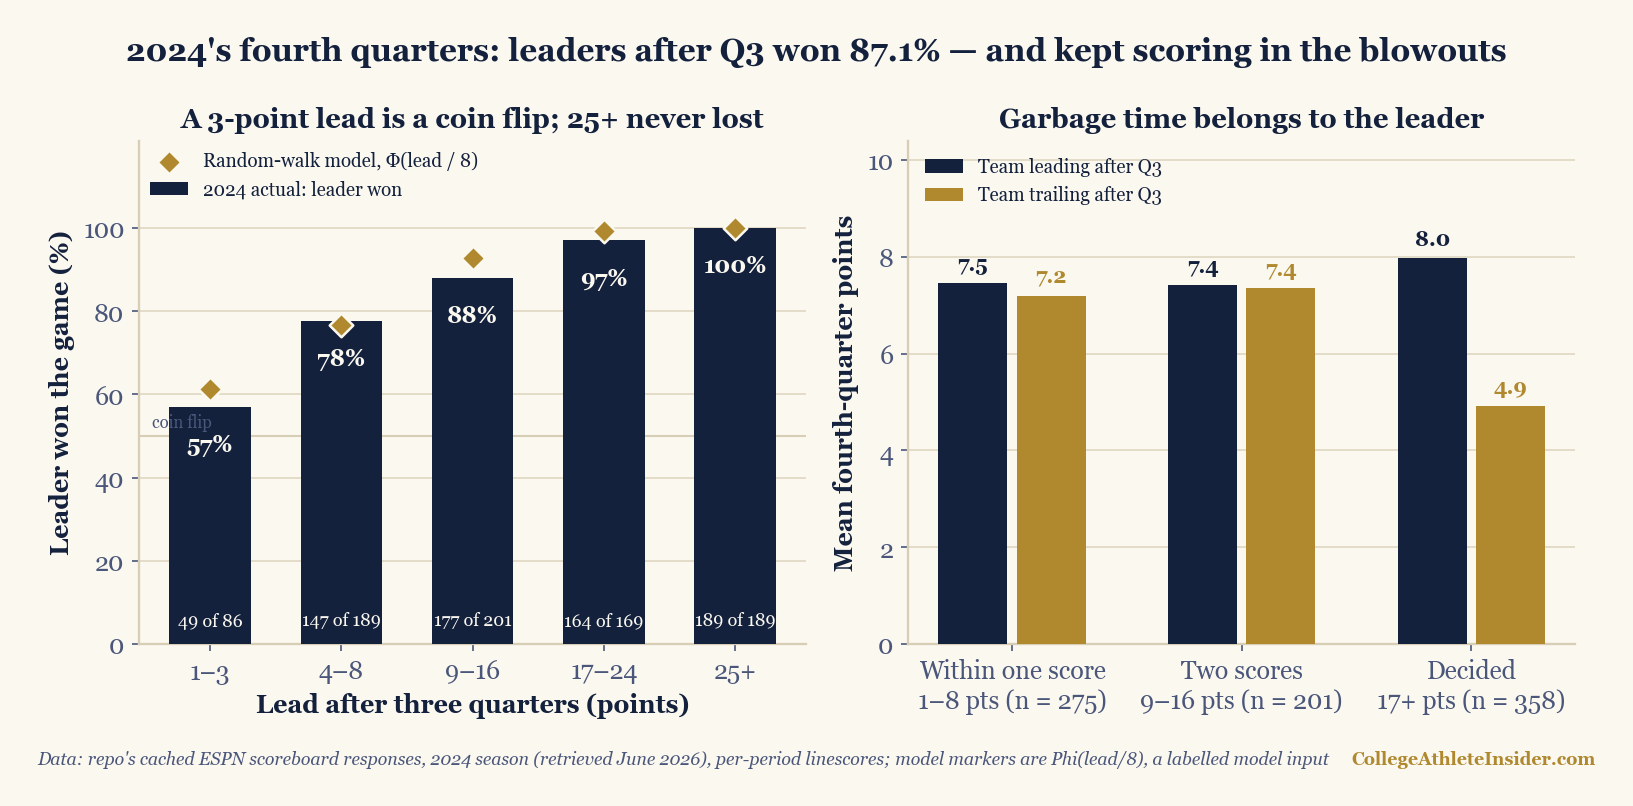
Of the 877 games, 834 had a leader after three quarters and 43 were tied. The leaders went 726–108. That 87.1% is the number to hold against the broadcast sentence — but it’s an average across wildly different situations, and the bands are the real story:
| Lead after Q3 | Games | Leader won | Hold rate | Comeback rate | Model says |
|---|---|---|---|---|---|
| 1–3 points | 86 | 49 | 57.0% | 43.0% | 61.3% |
| 4–8 points | 189 | 147 | 77.8% | 22.2% | 76.8% |
| 9–16 points | 201 | 177 | 88.1% | 11.9% | 92.8% |
| 17–24 points | 169 | 164 | 97.0% | 3.0% | 99.2% |
| 25+ points | 189 | 189 | 100.0% | 0.0% | 100.0% |
| All leaders | 834 | 726 | 87.1% | 12.9% | 88.8% |
Read the extremes first. A lead of 1–3 points is barely a lead at all: 57.0%, seven points of win probability better than a coin flip. At the other end, a 25-point lead entering the fourth quarter was literally never lost — 189 games, 189 holds — and even the 17–24 band leaked only five. The two clichés about the fourth quarter live in different rows of this table: “anything can happen” is a true statement about 86 games and a false one about 358. For calibration, the halftime version of the same checkpoint runs softer, as it should: teams leading at the break won 83.4% (679 of 814 games with a halftime leader). Thirty more minutes of football buys less reversal than the sport’s mythology suggests — the third quarter moves the number less than four points.
The 43 games tied after three quarters are their own small lesson: home teams went 22–21, and 9 of the 43 needed overtime. Once the fourth quarter starts level, nobody knows anything — which is the overtime census’s conclusion arriving fifteen minutes early.
The model meets the tape
The lead-safety piece on this site models a lead as a random walk: P(hold) = Φ(lead / σ), with σ = 16 × √(t/60) = 8 points at the start of the fourth quarter. That article was pure theory — its SD is a labelled model input, not game data — and this census is the first time this site can grade it against real fourth quarters. The verdict: startlingly good in the middle, a shade too smug everywhere else. In the one-score band (4–8 points) the model says 76.8% and the season delivered 77.8 — agreement to a point on 189 games. But the model overshoots the leader’s chances in every other band: 61.3 predicted versus 57.0 actual at 1–3, 92.8 versus 88.1 at 9–16, 99.2 versus 97.0 at 17–24. Across all 834 leaders it predicts 88.8% holds against 87.1% observed.
Two honest cautions on that comparison. First, none of the individual gaps is statistically loud — at n = 201, the 9–16 band’s 4.7-point miss is about two standard errors; the direction is consistent, the significance is not. Second, the direction itself is the interesting part, and it runs against the obvious confound. Big third-quarter leads select for mismatched teams, so real holds should beat a model that assumes equal teams — and instead they lag it. My reading, labelled as a reading: fourth-quarter football isn’t a symmetric random walk. Trailing teams shorten the game’s memory — urgency, tempo, onside kicks, fourth-down aggression — while leading teams deliberately trade points for clock. The result is a small, persistent transfer of comeback probability that a drift-free model can’t see. Small: about 1.7 points of hold rate. Persistent: every band but one.
The 108 comebacks, and who gets to make them
One hundred eight teams trailed at the third-quarter gun and won: 12.9% of games with a leader, roughly one in eight. Ninety-six finished the job in regulation; 12 needed overtime — they tied the game in the fourth and won it after 0:00, which is how 30 of the season’s 35 overtime games came from scoreboards within one score entering the fourth. Only 15 comebacks all season started from 13 or more down, and only 5 from 17 or more — five reversals in the 358 games that looked decided, 1.4%. Here is the complete list; there is no sixth:
| Date | Game | After Q3 | Q4 | Final |
|---|---|---|---|---|
| Oct 12 | Georgia Southern vs Marshall | 3–23 | 21–0 | 24–23 |
| Oct 26 | Tulsa vs UTSA | 24–42 | 22–3 | 46–45 |
| Aug 24 | Montana State at New Mexico | 14–31 | 21–0 | 35–31 |
| Oct 5 | Miami at California | 18–35 | 21–3 | 39–38 |
| Nov 29 | Colorado State vs Utah State | 13–30 | 29–7 | 42–37 |
The anatomy is strikingly uniform: every one of the five was won by five points or fewer, and in four of the five the defense allowed a field goal or nothing while the offense erased the deficit — these are not shootouts rejoined but games where one side went silent. Miami’s is the marquee entry: ranked No. 8 in the feed’s own snapshot, down 35–18 in Berkeley at the boundary, 21–3 across the fourth to win 39–38 — the only ranked team on the list, and one of only two that did it on the road. The other road entry is the strangest: Montana State, an FCS side (one cache appearance, the same guarantee-game proxy the margin census uses), blanked New Mexico 21–0 in the fourth on opening weekend to win 35–31. And Georgia Southern deserves its own sentence: three weeks after the 23–3 resurrection against Marshall, the Eagles trailed South Alabama 30–14 entering the fourth and won 34–30 on a 20–0 quarter — the season’s sixth-biggest reversal. One program, five weeks, two of the six largest comebacks in the cache, one at home and one on the road. If you want a mascot for the exception clause, it wears blue and white in Statesboro.
Who gets to come back is not evenly distributed, and the split is the article’s quietest big number: home teams trailing after three quarters came back 18.7% of the time (56 of 299); road teams, 9.7% (52 of 535). Nearly double. Equivalently, home leaders held 90.3%, road leaders 81.3%. Part of that is surely quality — the home-field piece spent its whole length showing how much of the raw home edge is really schedule composition, and a home team down 10 is more often the better roster than a road team down 10. But whatever the mixture of crowd, travel, and quality, the operational fact stands: the fourth-quarter comeback is disproportionately a home-crowd genre. Three of the five 17+ reversals above — Georgia Southern, Tulsa, Colorado State — happened in front of the winner’s own crowd, and the road pair had asterisks of their own: a No. 8 team, and a season opener against a New Mexico side that finished its cached season 5–7.
Garbage time, audited
The second half of the fourth quarter’s reputation is “garbage time” — the idea that once a game is decided, the remaining points are noise, scored by desperate trailers against disinterested defenses. The cache agrees the points keep coming and disagrees completely about who scores them. First, volume: the fourth quarter averaged 13.9 combined points, second only to the second quarter’s 16.2 (the first and third ran 11.5 and 11.9 — halves end loudly in this sport, both of them). Games already decided by 17+ entering the fourth — 358 of them, 40.8% of the season — still produced 12.9 fourth-quarter points a game, barely below the 14.6 in games within one score. Add it up and 37.7% of every fourth-quarter point in 2024 (4,613 of 12,228) was scored in a game that was already, statistically, over. Scoreboard-watchers averaging “Q4 scoring” across a Saturday are measuring, to a first approximation, two-fifths dead rubber.
Now the composition, which is where the cliché dies. In those 358 decided games, the team leading after three quarters scored 8.0 fourth-quarter points on average; the trailer managed 4.9. The leader outscored the trailer in 200 of the 358 fourth quarters; the trailer won the quarter in just 90 (68 were even). In close games the split is 7.5 to 7.2 — symmetric, as a live game should be. The popular image of garbage time — backups yielding cheap touchdowns to the losing side’s starters — is backwards in this data: the mismatch that built the 17-point lead keeps operating, clock management notwithstanding. The season’s loudest exhibit is Tulsa at South Florida on November 23: 49–7 after three quarters, at which point the teams combined for 37 fourth-quarter points (23 of them finally Tulsa’s) on the way to 63–30 — a “decided” game that outscored most live ones. Genuine kneel-out endings exist but are rare: only 24 of the 358 decided games had a scoreless fourth quarter. One caveat belongs in bold: linescores cannot see substitutions. “Garbage time” properly defined is about who is on the field, and separating starters’ points from backups’ points needs play-by-play data this cache does not hold. What the cache can say is narrower and still useful: whoever was on the field, the points in decided games flowed to the winner.
Where this can mislead you
- Quarter boundaries only. The checkpoint is the scoreboard at the end of the third quarter. Leads that changed inside a quarter are invisible, and “biggest comeback” means biggest boundary deficit erased — Miami’s hole was 35–18 at the gun; whatever it was mid-quarter, the cache can’t see it.
- One season, one window. 877 games, August 24 through December 21, 2024; no quarterfinals onward, no January bowls. The 1–3 band is 86 games; its 57.0% carries a standard error around five points. Treat the band table as a measurement of 2024, not a law.
- Lead size is confounded with team quality. Teams up 25 entering the fourth are usually much better, not just luckier — the 100.0% row measures both the lead and the mismatch. That’s precisely why the equal-teams model should undershoot reality at big leads, and the fact that it overshoots instead is the finding.
- “Decided” is a scoreboard convention, not win probability. I use 17+ (three scores) entering the fourth. Five of 358 such games flipped, so the label was 98.6% honest — but it is a threshold, not a truth.
- The home/road comeback gap is descriptive, not causal. 18.7% versus 9.7% mixes crowd, travel, and roster quality; this census cannot apportion it. The home-field piece is the antidote to over-reading it.
- The model comparison grades one checkpoint. Φ(lead/8) is the lead-safety article’s curve evaluated at 15:00 remaining only. Nothing here tests its five-minute or two-minute claims — that would need in-game timestamps.
- Rate ≠ rarity on a full slate. Across all 877 games, 12.3% flipped after the third quarter — one in eight, and also, by plain arithmetic, seven or eight flipped leads on the season’s biggest Saturdays (the cache’s largest single days run 54–65 games). Highlight shows are a biased sample of a true phenomenon.
The takeaway
The fourth quarter of a 2024 college football game was two different institutions wearing one name. In the 36.3% of games within one score at the third-quarter gun, it was everything advertised: a 1–3 point lead held barely better than a coin flip, one-score leads leaked 22% of the time, twelve games needed the fourth just to reach a tie, and home crowds bent outcomes hard enough to double the comeback rate. Everywhere else it was a formality that happened to be televised: 98.6% of three-score leads held, no 25-point lead fell all season, and the points that kept landing — nearly two-fifths of all fourth-quarter scoring — flowed mostly to the team already winning. So the broadcaster’s sentence needs an amendment the data will actually sign: anything can happen in the fourth quarter of a one-score game. Five times in 358 chances, something happened anyway — which is why Statesboro got two parades and Berkeley got a very quiet flight home. Rare enough to disbelieve; frequent enough to keep watching. That ratio is the sport’s entire business model, and for once the close-game luck piece and the highlight reel agree on it.
Reproduce it
The checkpoint is one subtraction; the census is one comparison. The chart above is rebuilt from the cache on every charts build by charts/chart_fourth_quarter.py, which recomputes every number in this article — the hold-rate bands, the model overlay, the comeback list, the home/road split, the garbage-time scoring shares — and warns if the cache stops reproducing any of them. The core:
q3 = lambda c: sum(p["value"] for p in c["linescores"] if p["period"] <= 3)
led = [g for g in games if q3(g.home) != q3(g.away)]        # 834 of 877
held = [g for g in led if (q3(g.home) > q3(g.away)) == g.home_won]
len(held) / len(led)                                        # 0.871
[g for g in led if abs(q3(g.home) - q3(g.away)) >= 25
   and g not in held]                                       # [] — 189 for 189
q4 = lambda c: [p["value"] for p in c["linescores"] if p["period"] == 4]
# decided (17+) games: leader mean 8.0, trailer mean 4.9 in Q4
Run python charts/chart_fourth_quarter.py and it prints the full audit — bands, comebacks, named-game linescores — before it draws a bar.
Sources & further reading
- Theory: Chapter 21: Win Probability Models — a free chapter at DataField.dev; a hold-rate table is a win-probability model with exactly one feature, and the chapter shows what the full-featured version adds.
- Data: my locally cached ESPN public-API scoreboard responses (
scripts/cache/, retrieved June 2026; provenance indata_layer/SOURCE.txt) — 877 completed 2024 games through December 21, finals and per-period linescores. - Every figure above is recomputed from that cache at build time by
charts/chart_fourth_quarter.py, which warns if any published number drifts. - The random-walk hold curve is the lead-safety article’s model — Φ(lead / (16√(t/60))) — evaluated at t = 15; its σ is a labelled model input, not cache output.
- Related: the full margin distribution (final margins, where this article’s Q3 margins end up), the overtime census (the 35 games where the fourth quarter ended level), and home-field advantage, measured (context for the 18.7% vs 9.7% comeback split).