"Two-score game" is the most repeated phrase in a football broadcast's final quarter, and it's doing a lot of unexamined work. The idea is that a 9-point lead is categorically safe because the trailing team needs two possessions. But "safe" isn't a yes/no — it's a probability that depends on exactly two things: how big the lead is and how much time is left. You can write that probability down with one short model, and once you do, a lot of late-game gut feelings turn out to be either too nervous or too smug.
The model: the scoreboard as a random walk
Treat the margin between two evenly-matched teams as a random walk — it drifts up and down as drives succeed and fail, with no built-in direction. From any moment in the game, the final margin is then approximately a bell curve centered on the current lead, and the width of that bell shrinks as the clock runs out (less time = less room for the margin to move). Formally:
P(leader holds) = Φ( L / σ(t) ), σ(t) = 16 × √(t / 60)
Here L is the current lead in points, t is minutes remaining, Φ is the normal cumulative distribution, and the 16 is the documented standard deviation of a full-game college football margin — the same scatter that makes the point spread miss individual games by a couple of touchdowns. The square-root term is the key: with a full 60 minutes left the bell is wide; with 4 minutes left it's narrow, because the score simply can't swing as far.
The curves: when a lead is actually safe
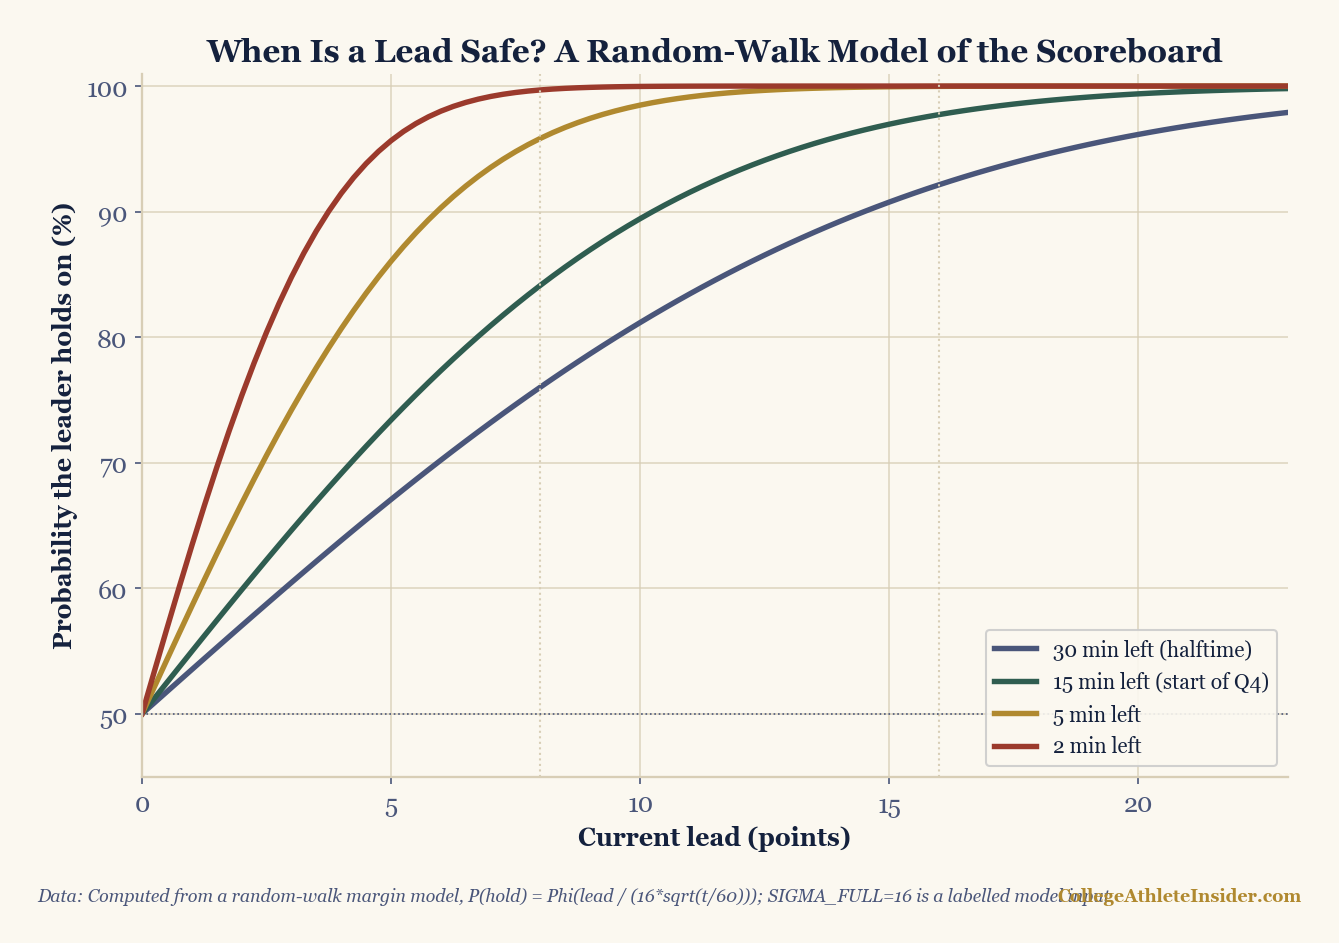
Read the curves and the "two-score game" mantra gets more precise. A one-score lead of 8 points is worth about 81% at the start of the fourth quarter, but climbs to 96% with five minutes left and 99% inside two minutes. The lead didn't change; the time did. Meanwhile a 14-point lead — genuinely two scores — is a comfortable 96% with a quarter to go but only about 81% back at halftime, which is why blowing a two-score halftime lead, while memorable, isn't actually freakish.
A worked example
Your team is up 10 at halftime — 30 minutes left. Plug it in: σ = 16 × √(30/60) = 16 × 0.71 ≈ 11.3, and P(hold) = Φ(10 / 11.3) = Φ(0.88) ≈ 81%. So a 10-point halftime lead holds about four times in five — good, but a one-in-five collapse is completely normal, not a choke. Now fast-forward: same 10-point lead with 5 minutes left. σ = 16 × √(5/60) ≈ 4.6, and P(hold) = Φ(10 / 4.6) = Φ(2.17) ≈ 98.5%. The identical lead went from "probably" to "all but certain" purely because 25 minutes of variance drained off the clock. That gap — 81% to 98% for the same 10 points — is the entire reason "protect the lead, milk the clock" is sound strategy: running time doesn't add points, but it shrinks σ.
Where this model is too simple
The random walk is a clean first approximation, and it leaves real things out — each of which you should keep in mind before betting your blood pressure on it:
- It assumes evenly-matched teams (zero drift). If the leader is also the better team, its true hold probability is higher than the curve; if it's a worse team clinging to a lead, lower. The model centers the bell on the current margin, not on talent.
- Possession and field position aren't in it. Up 3 with the ball on the opponent's 30 is far safer than up 3 having just kicked off. Real win-probability models fold in down, distance, and who has the ball; this model only knows the score and the clock.
- Scoring isn't a smooth diffusion. Points come in lumps of 3, 7, and 8, and late-game football is a sequence of discrete possessions, not continuous noise. The normal approximation is good in the middle and frays at the very end, where the exact number of remaining possessions matters more than √t.
- End-game tactics distort variance. A trailing team throwing deep and stopping the clock raises variance (more comeback chance than the model says); a leader in victory formation lowers it. The σ in the formula is an average, not a constant.
- The 16 is a representative number. The full-game margin SD varies by era and by level of play; nudge it and every curve shifts. Treat the percentages as well-calibrated estimates, not decimals to trust.
The takeaway
"Is this lead safe?" has an answer, and it's a probability, not a category. The model says what every coach feels in their gut: a lead's security depends as much on the clock as on its size, because time is just variance waiting to happen. A one-score lead is a coin-flip-and-a-half early and a near-lock late; a two-score lead is comfortable in the fourth quarter and merely probable at halftime. Next time the booth says "two-score game" like it settles things, check the clock — that's the variable doing the real work. You can run lead-and-time scenarios yourself on the Calculators hub.
Sources & further reading
- Background: Chapter 21: Win Probability Models (DataField.dev).
- The random-walk / Brownian-motion model of a sports scoreboard is a standard approach (e.g. Stern's work on in-game win probability); the curves here are computed directly from the normal CDF, with the full-game margin SD (16) entered as a labelled model input.
- Related: How college football win probability models work — the fuller models that add possession and field position.
- Related: The math of field goal range and the two-point decision — other late-game calls where the clock and the score set the math.