On the same seed line, a team that was in the preseason AP Top 25 has won nearly a quarter of a game more in the NCAA tournament than a team that was not. In the 22 men's tournaments from 2003 to 2026 that ESPN's data can pair with a preseason poll, the 459 teams the poll had ranked won 0.15 games per tournament more than the average for their seed lines, and the 949 it had not ranked won 0.07 fewer. Of the 88 No. 1 seeds, the 82 that were ranked in the preseason averaged 3.50 wins and the six that were not averaged 1.50. The only two No. 1 seeds in these tournaments to lose to a No. 16, Virginia in 2018 and Purdue in 2023, had both been outside the preseason 25.
The poll at the other end of the season does not do this. Grouped by the last AP poll before the bracket, which ESPN's feed holds for 20 of the 22 tournaments, teams finish within two-tenths of a win of their seed lines whatever their rank, and that poll's top five fall 0.06 short. A team ranked in the last poll but not in the preseason one won 0.21 games fewer than its seed line; a team ranked in the preseason poll and gone from the last one won 0.14 more. By the time the bracket is drawn, the seed holds what the late poll knows, and not all of what the early one knew.
ESPN's schedule has the 2026-27 season opening on Sunday, November 1, with Notre Dame at Villanova and Liberty at High Point, and 182 games the next day. Its rankings feed has no preseason poll for the season yet; the last five were dated between October 13 and October 18. Here is what that poll has been worth by the time the bracket comes out.
What was pulled, and how a team is scored
data_layer/build_cbb_preseason_poll_2003_2026.py pulls every men's preseason AP Top 25 that ESPN's core rankings API holds from 2002-03 to 2025-26, with the points of every team receiving votes, and the AP polls at the end of each regular season. It then walks ESPN's public scoreboard from March 11 to April 10 of each year, one date at a time, and keeps every NCAA tournament game; in those games ESPN records each team's seed. Two seasons drop out. The feed has no preseason AP poll for 2010-11, and 2019-20 had no tournament: ESPN keeps that bracket as 63 canceled games between teams listed as TBD. That leaves 22 tournaments and 1,408 teams in the round of 64.
Every tournament is checked against the shape a bracket has to have: 63 games from the round of 64 on, four teams on each seed line, and exactly one team with six wins, one with five, two with four, four with three, eight with two, 16 with one and 32 with none. All 22 pass, after three repairs that the data file records. Through 2008 ESPN marks the opening-round game neither as a tournament game nor with seeds, so the builder finds it by rule. On March 14, 2017, ESPN's Division I scoreboard lists neither of that night's First Four games, and the builder recovers them from ESPN's tournament scoreboard. And the 2021 game between Oregon and VCU was never played; ESPN's note reads “Oregon advances due to uncontested game,” so Oregon is counted as advancing and VCU as a round-of-64 team with no win.
The score is wins above the seed line. Across the 22 tournaments the 88 No. 1 seeds won 296 games, 3.36 each; the 88 No. 8 seeds won 55, 0.625 each; the 88 No. 16 seeds won 2. A team's wins minus the average for its seed line is what it did that the seed did not predict. Play-in games do not count, so a First Four winner is scored from the round of 64 on. Each tournament hands out 63 wins, so the measure sums to zero over all 1,408 teams: one group can run ahead of its seeds only if another runs behind.
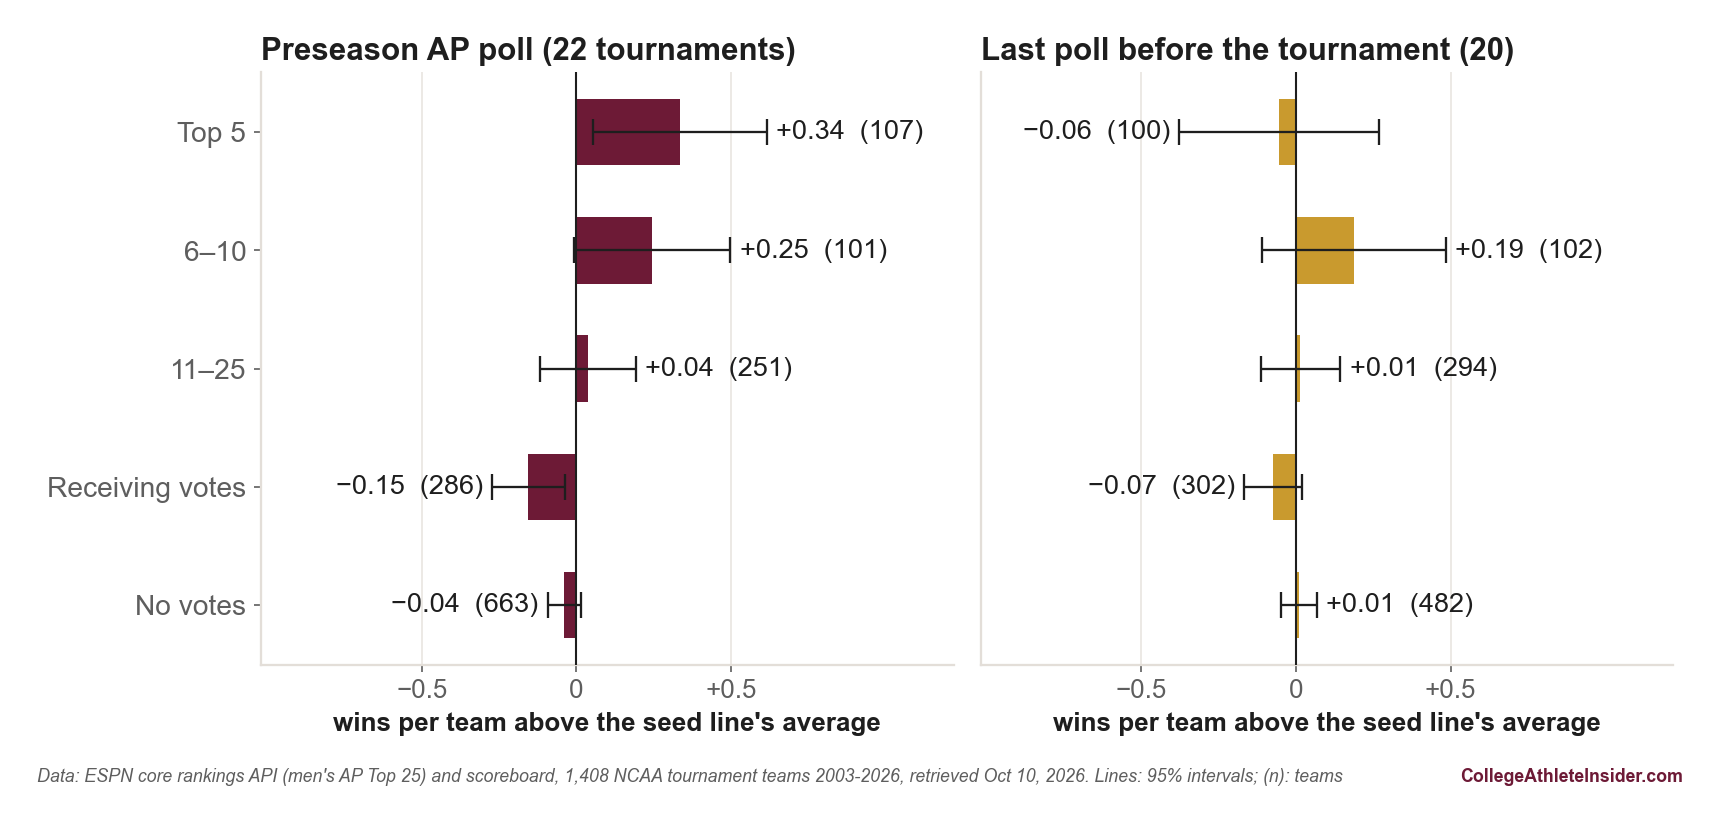
charts/chart_cbb_preseason_poll.py — 280 checks.The two polls, measured against the seed
| Poll position | Teams, preseason | Above, preseason | Teams, last poll | Above, last poll |
|---|---|---|---|---|
| Top 5 | 107 | +0.34 | 100 | −0.06 |
| 6–10 | 101 | +0.25 | 102 | +0.19 |
| 11–25 | 251 | +0.04 | 294 | +0.01 |
| Receiving votes | 286 | −0.15 | 302 | −0.07 |
| No votes | 663 | −0.04 | 482 | +0.01 |
| Ranked, 1–25 | 459 | +0.15 | 496 | +0.04 |
| Not ranked | 949 | −0.07 | 784 | −0.02 |
The preseason column steps down from the top five to the teams receiving votes; the last-poll column does not step at all. The gap between ranked and unranked teams in the preseason poll is 0.227 wins per team, with a standard error of 0.067. Shuffled 10,000 times among the teams on each seed line, the preseason labels produced a gap that large once. The gap is 0.227 in the eleven tournaments from 2003 to 2014, 0.227 in the eleven from 2015 to 2026, and 0.239 with 2021 left out. One reason the no-votes row sits nearer zero than the receiving-votes row is that it is mostly low seeds, whose lines win little to begin with: its teams' seed lines average 0.45 wins a team, against 1.02 for the teams receiving votes.
Same seed line, different preseason
| Seed | Ranked: teams | Ranked: wins per team | Not ranked: teams | Not ranked: wins per team |
|---|---|---|---|---|
| 1 | 82 | 3.50 | 6 | 1.50 |
| 2 | 74 | 2.46 | 14 | 1.43 |
| 3 | 48 | 1.75 | 40 | 2.20 |
| 4 | 54 | 1.74 | 34 | 1.29 |
| 5 | 43 | 1.47 | 45 | 0.84 |
| 6 | 42 | 1.05 | 46 | 0.72 |
| 7 | 31 | 1.23 | 57 | 0.82 |
| 8 | 28 | 0.93 | 60 | 0.48 |
| 9 | 25 | 0.60 | 63 | 0.73 |
| 10 | 14 | 0.79 | 74 | 0.49 |
| 11 | 13 | 1.23 | 75 | 0.64 |
Nine of the eleven lines favor the teams the preseason poll ranked. None of the six No. 1 seeds it had left out reached a Final Four: Syracuse in 2010, Michigan State in 2012 and Arizona in 2022 won two games each, Oregon in 2016 won three, and Virginia in 2018 and Purdue in 2023 lost their first games, 74-54 to UMBC and 63-58 to Fairleigh Dickinson. The No. 3 and No. 9 lines run the other way. On the No. 3 line the 40 teams the poll had not ranked won 2.20 games each, against 1.75 for the 48 it had. Two of the 40 won the title, Syracuse in 2003 and Florida in 2006, and three more lost in the final, Georgia Tech in 2004, Michigan in 2018 and Texas Tech in 2019. A line of 88 teams can hold a cluster like that, which is why the total across the lines is the figure to trust rather than any one row.
The preseason poll against the last one
ESPN labels its polls by week, and the labels do not say which poll was the last before the tournament; the 2025 feed even holds a poll dated April 8, after the championship game. So the builder pulls the last three regular-season polls and every postseason poll, and the chart script keeps the one whose records match the teams' records entering the tournament, taken from ESPN's record after each team's first tournament game. In 19 seasons the poll it keeps matches every record tested. In 2003 it matches 22 of 24, with Marquette and Dayton each one game off. No other candidate matches more than four. In 2005 and 2006 the feed's postseason weeks hold no AP poll and no candidate matches a single record, so those two tournaments are left out of this comparison.
| Preseason poll | Last poll | Teams | Wins per team | Above the seed line |
|---|---|---|---|---|
| Ranked | Ranked | 310 | 2.25 | +0.18 |
| Ranked | Not ranked | 107 | 0.87 | +0.14 |
| Not ranked | Ranked | 186 | 1.20 | −0.21 |
| Not ranked | Not ranked | 677 | 0.36 | −0.05 |
The middle rows are the test. The 107 teams the voters ranked in the preseason and had dropped by March won fewer games than the 186 they found during the season, 0.87 a team against 1.20, because they were seeded lower. Against their seed lines, the dropped teams ran 0.14 ahead and the late discoveries 0.21 behind. The difference, 0.34 wins a team, is 2.6 standard errors. Kentucky in 2014 is the first kind of team. Virginia in 2018 is the second: receiving votes in the preseason, first in the last poll, and beaten by UMBC.
A worked example: the 2014 final
Kentucky began the 2013-14 season as the preseason No. 1 and ended it outside the last poll, receiving votes, as a No. 8 seed. The 88 No. 8 seeds in these tournaments won 55 games, 0.625 each. Kentucky won five, so it ran 5 − 0.625 = 4.375 wins ahead of its line, the most for any team that was ranked in the preseason poll and missing from the last one. North Carolina in 2022 matched it: 19th in the preseason, unranked in the last poll, a No. 8 seed, and a finalist. Kentucky lost its final 60-54 to UConn, a No. 7 seed that was 18th in the preseason poll and 18th in the last one. The 88 No. 7 seeds won 85 games, 0.966 each, so UConn's title is 6 − 0.966 = 5.03 wins above it.
A group's figure is the same arithmetic summed. The 107 teams in the preseason top five won 296 games. Adding up the average of each one's seed line gives 260.05, so they won 35.95 games more than their seeds predicted: 35.95 ÷ 107 = 0.336 a team. The 286 teams receiving votes won 247 games against 291.27, 44.27 short, or −0.155 a team.
Where the champions started
All 22 champions received at least one preseason vote. Sixteen were in the preseason top ten and eleven in the top five; the three that began outside the 25, Syracuse in 2003, Florida in 2006 and UConn in 2023, were all receiving votes. Of the 88 Final Four teams, 73 had been ranked in the preseason poll and 50 in its top ten. The preseason No. 1 won three of the 22 titles, UConn in 2004, Florida in 2007 and North Carolina in 2009, and missed the tournament once, North Carolina in 2023. Of the 552 teams the preseason polls ranked, 464, or 84%, made the field, between 18 and 24 a year.
Limits
A seed line is a blunt yardstick. Each team is compared with the average of its line over 22 tournaments, so the measure ignores which opponents a team drew, how strong its region was and where it played. Groups are noisy. Their standard errors run from 0.03 to 0.14 wins; the top-five and 6–10 groups cannot be told apart, and two of the eleven seed lines run the other way. The ranked-versus-unranked gap is the figure that holds, in both halves of the period and under the shuffle test. Only teams with a seed are scored. The 88 preseason-ranked teams that missed the field, and the five that lost play-in games, are not in the comparison, which asks what the preseason poll adds once the bracket is set. Why, the data cannot say. A preseason ballot is cast before a game is played; the season then adds results, close games and injuries, and the seed follows the results. One reading is that the preseason poll holds part of a team's strength that a season's record understates, the case for keeping a prior that the piece on when the record starts to mean something makes for football. Nothing here separates that reading from others. ESPN's feed has gaps, all described above: no preseason poll for 2010-11, no last poll for 2005 and 2006, two 2003 records a game apart, and one 2018 First Four loser, LIU Brooklyn, listed without a seed, which touches no round-of-64 team. Men's tournament only. After the fact: the seed-line averages come from these same 22 tournaments, so the measure describes them rather than forecasting the next one.
Sources and reproducibility
AP Top 25 polls from ESPN's core rankings API, sports.core.api.espn.com/, where the preseason poll is type 2, week 1, and a season is named by the year it ends; NCAA tournament games from ESPN's public scoreboard, site.api.espn.com/, walked one date at a time, with groups=100 for the one season in which the Division I scoreboard came up short. Retrieved October 10, 2026 by data_layer/build_cbb_preseason_poll_2003_2026.py and saved as data_layer/cbb_preseason_poll_2003_2026.json; the builder refuses to write if a tournament is missing any of its 63 games or play-in games, or if a game is unfinished. Every number on this page is recomputed by charts/chart_cbb_preseason_poll.py, registered in charts/build_charts.py, which runs 280 checks, including the bracket-shape checks and the record match that picks each last poll, and refuses to draw the chart if one fails. The shuffle test uses a fixed seed, so it returns the same count on every run.
The football side of the poll question is in what moves the AP poll, which found the football poll keeping its August order as a queue. Bracket math reads a seed line as a compressed rating, and experience and continuity in March covers the roster questions a preseason ballot has to guess at. The measurement here says those guesses carry something the bracket leaves out, nearly a quarter of a win's worth on the same seed line.