Louisiana State announced a crowd of 102,321 when Clemson came to Baton Rouge, and 102,321 again the following week for Louisiana Tech. Iowa announced 69,250 for Northern Illinois and 69,250 for Iowa State. Georgia Tech put 52,113 in the book for Colorado and 52,113 for Tennessee. Seven of the 39 hosts that played at home twice in the first two weeks of the 2026 season announced the identical figure both times — not approximately, to the person — and across all 78 of those games 97.7% of the variation in announced attendance is between stadiums rather than within them. The number that gets read out at the end of a broadcast is a property of the building and the season-ticket book. It is very nearly not a measurement of the game at all.
What was pulled, and where it stops
Week three is being played while I write this, so the window is frozen at the last completed slate and the freeze is enforced in code rather than in my good intentions. data_layer/build_weeks_1_2_2026_attendance.py walks ESPN's public college-football scoreboard one calendar day at a time — the date-range form of that query now returns an error, so every builder in this folder walks single dates — and keeps a game only when its Eastern kickoff date falls in September 3–7 (this site's week one) or September 10–12 (week two). That is 177 games, 91 and 86. Nothing from September 19 is in the file, and the builder refuses to write if any kept game is unfinished.
The attendance and the venue are not on the scoreboard; they live in each game's own summary response, so the pull makes one call per game. 174 of the 177 carry a figure. Three report nothing, and ESPN writes a zero rather than omitting the field: Indiana State at Purdue, UTEP at Oklahoma, and Tulsa at Sam Houston. They are dropped, not guessed. Stadium capacity is not available from either endpoint — ESPN's venue resource carries the address, the surface and an indoor flag and no capacity — so there is no fill rate anywhere in this piece, and I would rather publish no percentage than one whose denominator I had to go shopping for.
The 174 figures total 7,633,121 announced attendees, 3,979,872 in week one and 3,653,249 in week two, across 135 distinct venues. The mean is 43,869, the median 38,145, the standard deviation 26,784. Twelve games announced six figures, topping out at 111,240 for Oklahoma at Michigan; five came in under 10,000, bottoming at 5,646 for San José State at Eastern Michigan. Largest over smallest is 19.7. The top seventeen average 100,866 and the bottom seventeen 11,046, a ratio of 9.1. College football's crowds are not one population.
The figures are not rounded, which makes the repeats stranger
An obvious explanation for a repeated figure is a lazy ledger — announce a round number, announce it again. The digits say otherwise. Of the 174 figures, 154 do not end in a zero at all, 16 end in exactly one, one ends in two, and three end in three. Only four are divisible by 100: TCU's 37,600, Kansas's 32,000, and Vanderbilt's 35,000, which it announced twice. The last digits are spread the way random last digits are spread — a chi-square of 12.667 on nine degrees of freedom, p = 0.178, nothing a reader should find suspicious.
So these are figures reported to the single ticket, and seven hosts reported the same one to the single ticket for two different opponents a week apart. A count of bodies through a turnstile does not do that. Whatever is being counted — tickets distributed, a season-ticket base plus a fixed allotment, a manifest settled before kickoff — it is a number the host already knows before anyone arrives. The feed does not document what the figure counts, and I am not going to assert a definition it does not carry. What I can show is what it behaves like.
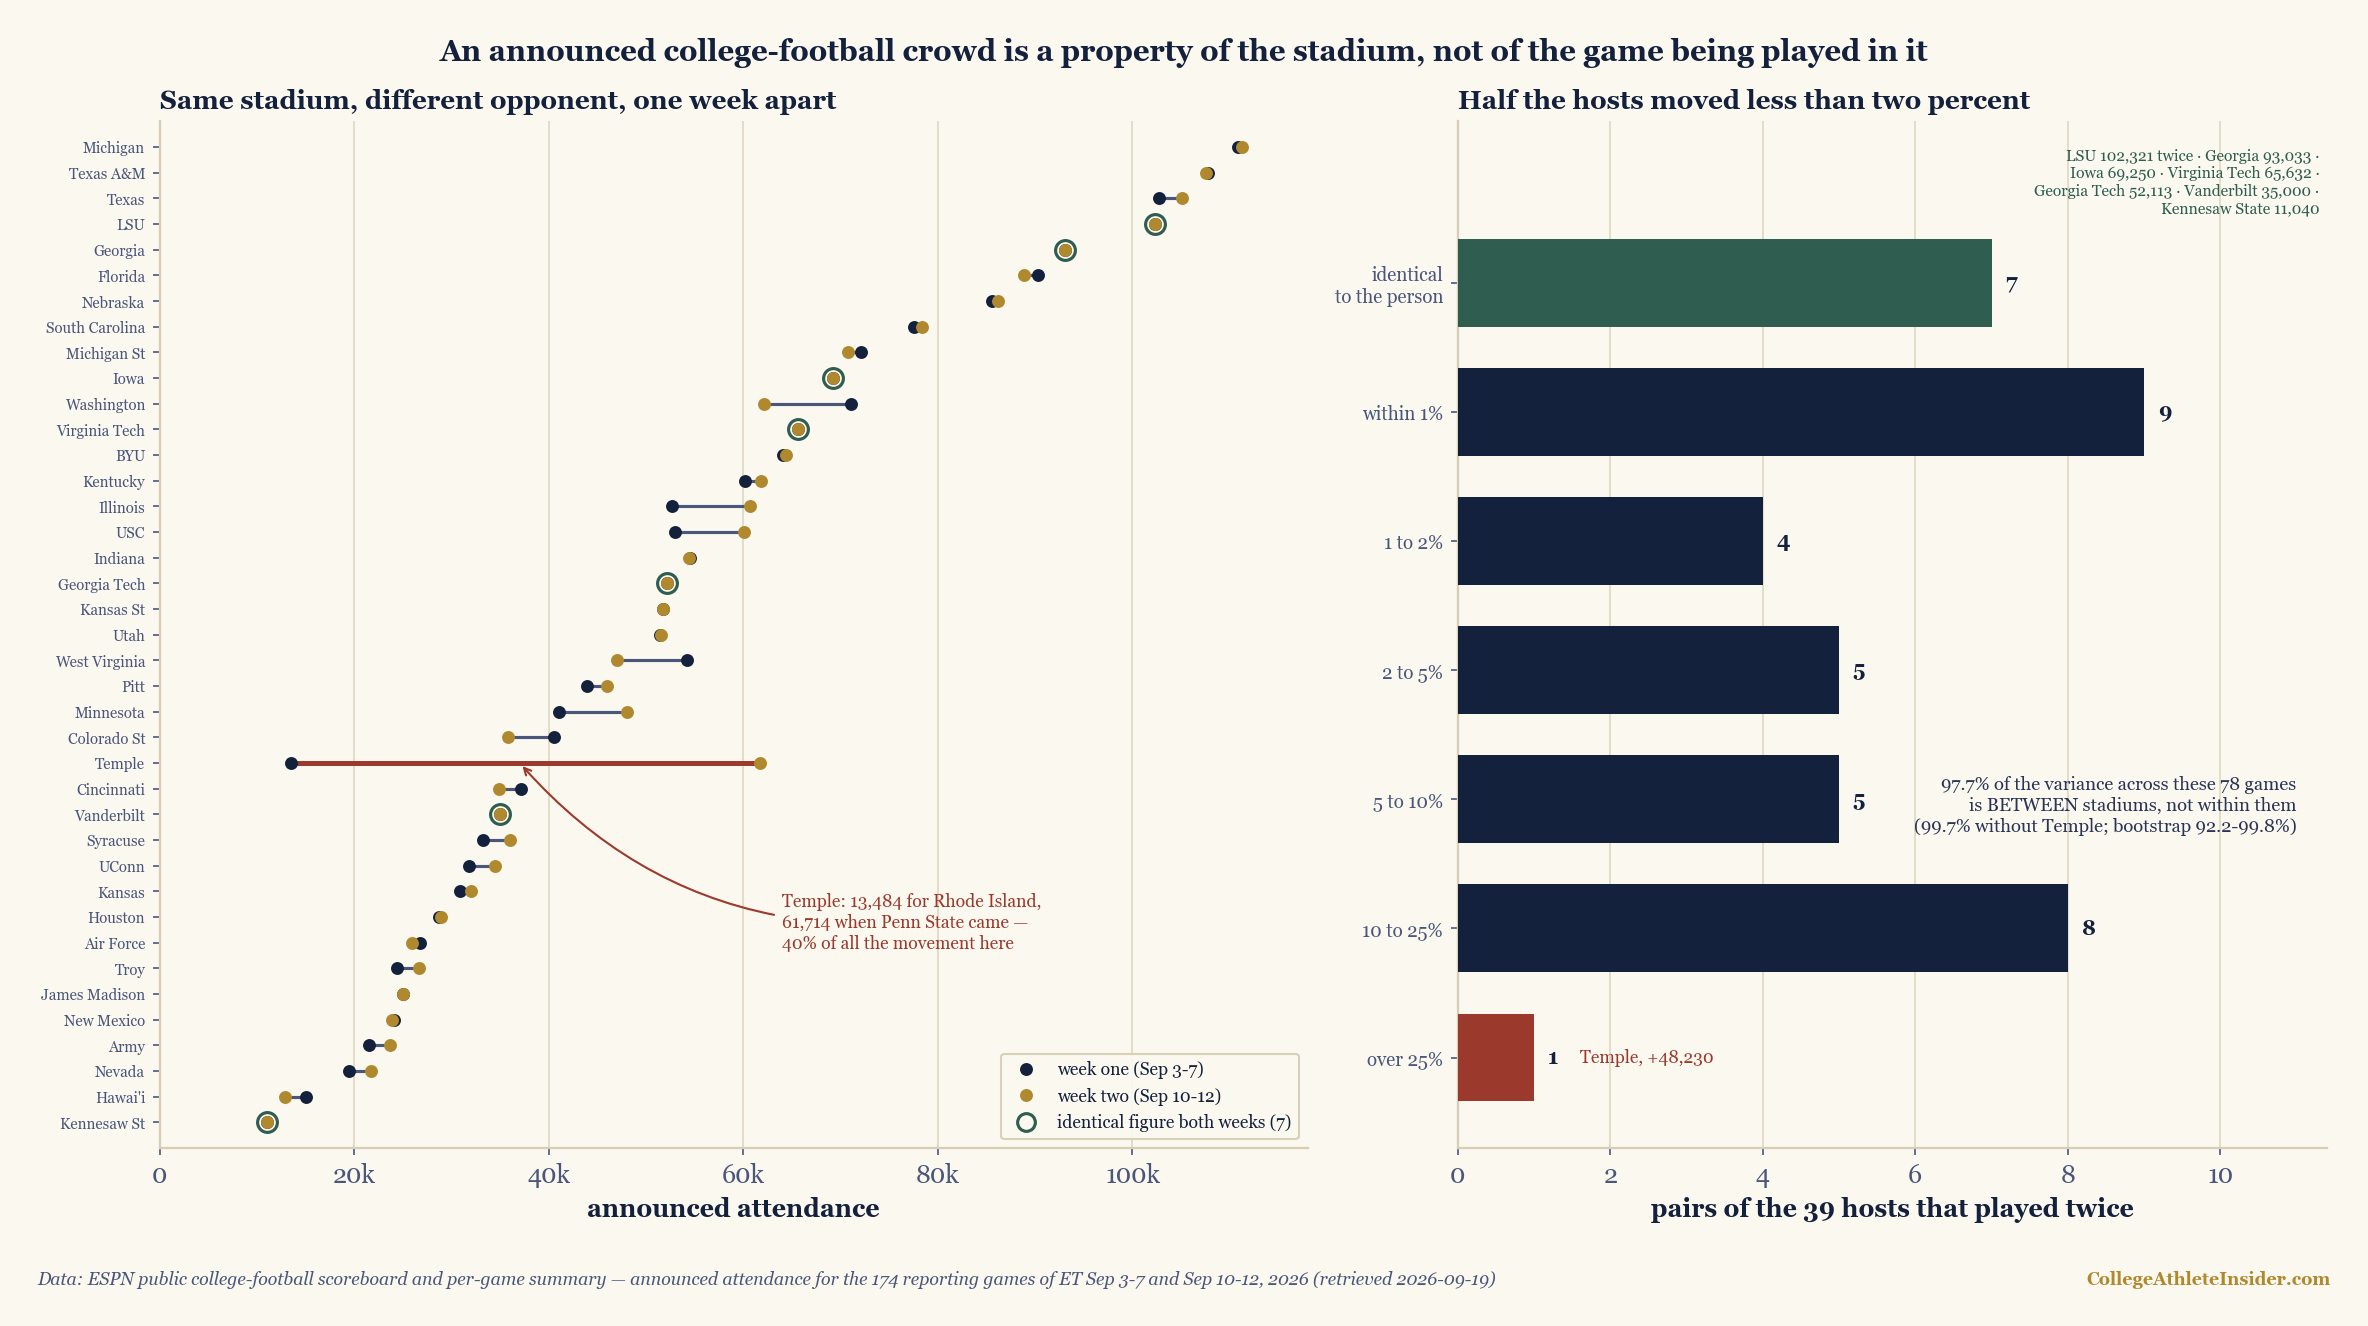
charts/chart_weeks_1_2_2026_attendance.py — 125 checks.The paired design
Comparing Michigan's crowd to Kennesaw State's tells you about stadiums, which is not interesting. The design that isolates the game is the pair: a venue that hosted the same team twice inside the frozen window, non-neutral, reporting both times. There are 39 of them, 78 games. Same building, same ticket book, same city, one week apart, different opponent. Whatever the announced figure responds to, it has to respond here or it does not respond at all.
It mostly does not. The median pair moved 1,096 people. Sixteen of the 39 moved less than one percent, 20 less than two percent, 25 less than five, 30 less than ten. The mean absolute change is 3,109, which is larger than the median because one pair is enormous. Against that, the standard deviation of the pair means — how far apart the stadiums are from each other — is 27,405, while the within-stadium standard deviation implied by those week-to-week changes is 5,848. Split the total sum of squares across the 78 games and 97.69% of it sits between venues. Resampling the 39 pairs 10,000 times with a fixed seed puts that share between 92.22% and 99.83%; even the floor of that interval is a number that leaves the game itself almost nothing to explain.
A worked example: the one host the opponent mattered to
Temple announced 13,484 against Rhode Island on September 5 and 61,714 against Penn State on September 12, in the same Philadelphia stadium both times. The difference is 61,714 − 13,484 = 48,230; the ratio is 61,714 / 13,484 = 4.577. Total movement across all 39 pairs, adding up the absolute changes, is 121,238 people, so Temple alone is 48,230 / 121,238 = 39.8% of every person who moved anywhere in the window. Drop that one pair and the between-stadium share of variance goes from 97.69% to 99.67% across the remaining 38.
That is not a reason to drop it. It is the clearest statement of the rule. Temple's own draw is small relative to its building, so its announced figure has room to respond to a visitor, and a visitor arrived who filled the room. For a host whose season-ticket book already accounts for the building, there is no room to respond, which is why LSU announced the same figure for Clemson and for Louisiana Tech. The opponent moves the gate exactly where the host does not already fill it.
The median pair makes the ordinary case concrete. Kansas announced 30,904 for Long Island University and 32,000 for Missouri: a change of 1,096 on a midpoint of (30,904 + 32,000) / 2 = 31,452, which is 3.48%. A Big 12 rival replaced an FCS visitor and the announced crowd moved by about the population of a large high school.
What it does track, and what it does not
Across the 171 games at a host site, the cross-sections look like a number that knows things. Games with an FCS visitor averaged 33,719 against 53,866 for all-FBS games; games with a ranked visitor averaged 60,326 against 42,494 without one; games with a ranked host averaged 73,118 against 35,648. That last gap is the largest of the three, and it is the tell: ranked hosts are disproportionately the programs with 90,000-seat stadiums, so the comparison is mostly reading the building again. The buy-game piece found the same structural sorting in the results; here it is in the gate.
Inside a stadium, where the building is held fixed, the opponent effect shrinks to something 39 pairs cannot resolve. Fourteen hosts upgraded from an FCS visitor in week one to an FBS one in week two and announced +4,715 on average; eleven went the other way and announced −945; fourteen had no class change and announced +493. The upgrade-minus-downgrade gap is 5,660 with a standard error of 3,495, t = 1.62. The sign is what anyone would guess and the size is not established, and I would rather say that than dress 39 pairs as a finding.
As for the game that broke out, the announced crowd knows nothing about it, which is what you would expect from a figure fixed before kickoff: its correlation with the size of the final margin is 0.158. Nor does the calendar move it much once you are at a home site — Thursday games averaged 39,818, Friday 39,894, Saturday 43,814 — a flatness that sits oddly beside the scoring and quality gaps the opening-weeknights piece measured in the same window. The three neutral-site games are excluded from the pairs and worth naming anyway: Baylor–Auburn drew 55,068 at Mercedes-Benz Stadium, Louisville–Ole Miss 57,390 at Nissan Stadium, and Wisconsin–Notre Dame 75,939 at Lambeau Field.
Limits
This is an announced figure, not a count. The feed does not say what it counts, and the seven exact repeats are evidence that for those hosts it is not people. Every number above describes the reported quantity and nothing else. No capacity, so no fill rate: the endpoints do not carry it, and a percentage built on a capacity scraped from somewhere else would be a different study with a different provenance. Thirty-nine pairs. The opponent effect does not clear two standard errors, and the bootstrap interval on the variance share is wide at its lower end. One outlier does real work: Temple is 39.8% of all the movement, so both versions are published. Two weeks in September. Openers are scheduled to be soft and sold as a package, students are arriving, and nothing here speaks to November. The cross-sections confound the building with the team, which is the entire reason the paired design exists. Three hosts reported nothing and are simply absent. FBS membership uses the house conference-id proxy with North Dakota State and Sacramento State excluded by name, and the weeks are this site's Eastern-kickoff weeks, September 3–7 and September 10–12, because ESPN's feed numbers them differently.
Sources and reproducibility
ESPN's public college-football scoreboard, site.api.espn.com/apis/site/v2/sports/football/college-football/scoreboard?dates=YYYYMMDD&groups=80&limit=300, walked one date at a time, and the per-game summary endpoint .../summary?event=<id>, whose gameInfo block carries the announced attendance and the venue. Retrieved September 19, 2026 by data_layer/build_weeks_1_2_2026_attendance.py and saved as data_layer/weeks_1_2_2026_attendance.json, which refuses to write if any kept game is unfinished, if any game falls outside the two frozen weeks, or if fewer than 95% of the kept games report a figure. Every number in this piece is recomputed by charts/chart_weeks_1_2_2026_attendance.py, registered in charts/build_charts.py, which runs 125 checks — including the variance decomposition, the seeded bootstrap and the digit test — and refuses to draw the chart if one fails. The decomposition is the ordinary one-way split of the total sum of squares by venue; the bootstrap resamples pairs, not games, because the pair is the unit.
The gate is the oldest number in the sport and it is the one I would trust least about any particular Saturday. It is stable because the thing it is made of — a building, a season-ticket base, a set of commitments made months ago — is stable, which is the same reason home-field advantage survives being measured and the same reason the money that runs a program is budgeted a year out. Seven hosts filed the identical figure twice and nobody blinked, because on the evidence of these two weeks that is roughly what a crowd number is for. The one host it told you something about was the one with 48,000 empty seats to fill.