Here is a claim that sounds reckless and is actually just arithmetic: a college team that converts two-point tries even a little under half the time should, on pure expected points, go for two every single time instead of kicking the extra point. Coaches don't, and there are real reasons they don't — but almost none of those reasons are the math. The math is one of the simplest decisions in the sport, and once you see it laid out you can't unsee how often the conventional kick is the lower-value play.
Two gambles, two expected values
After a touchdown you choose between two bets, and each has an expected value measured in points. Expected value is just the payoff times the probability of getting it.
- Kick the PAT. Worth 1 point, but not automatic. College kickers make the extra point around 94% of the time, so its expected value is
1 × 0.94 = 0.94 points. - Go for two. Worth 2 points, at some conversion rate p. Its expected value is
2 × p.
That's the whole model. Going for two is the higher-EV call whenever 2p > 0.94 — which rearranges to a break-even conversion rate of p = 0.47. Convert better than 47% of the time and, on average, you bank more points by going for two. Convert worse and the kick wins.
The crossover, drawn
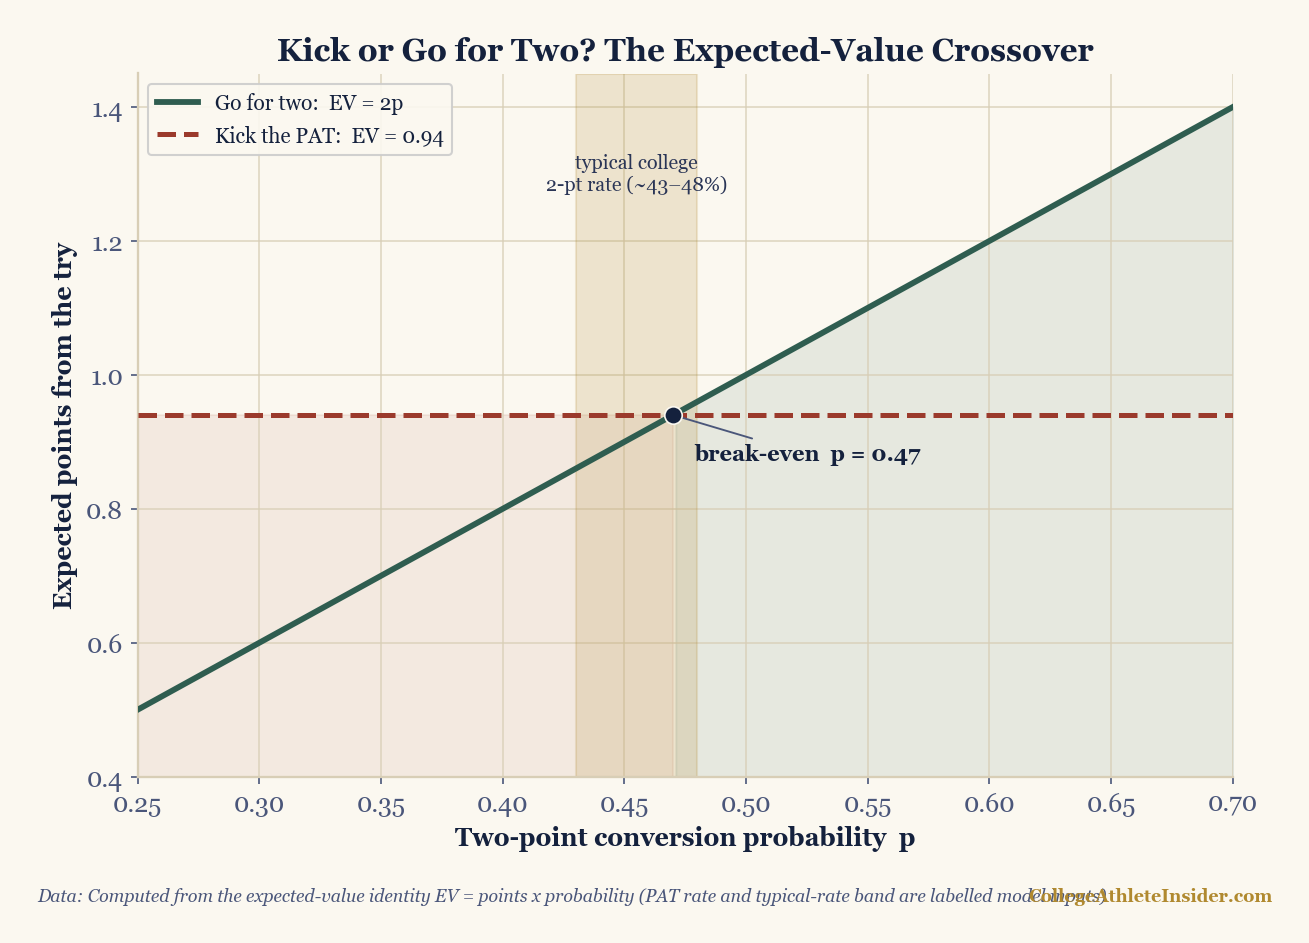
2p. They cross at a two-point rate of 0.47. The gold band is the typical college conversion range — it sits right on top of the break-even line, which is exactly why the decision is a genuine coin-flip rather than obvious either way. Computed from the expected-value identity EV = points × probability; the PAT rate and the rate band are labelled model inputs, not game data.The reason this decision is actually interesting — rather than a slam dunk in one direction — is visible in the chart. The typical college two-point rate band (roughly 43–48%) straddles the 47% break-even line. The average team is sitting almost exactly on the crossover, so for most teams, in a vacuum, the two calls are nearly equal in expected points. The decision tips on the margins: who your personnel are, who you're playing, and — the part the EV chart leaves out — the score.
A worked example
Suppose your offense is good in short-yardage and you believe your true two-point rate is 52%. Then:
EV(go for two) = 2 × 0.52 = 1.04 points
EV(kick PAT)   = 1 × 0.94 = 0.94 points
Going for two is worth 0.10 points more per attempt. That sounds trivial, but run it across a season of, say, 55 touchdowns and it's about 5.5 extra points — a touchdown's worth of expected scoring that a team leaves on the field by reflexively trotting out the kicker. Flip it: a team that converts only 40% has EV = 0.80, well below the kick's 0.94, and should keep kicking. The same formula gives opposite advice to two different teams, which is the honest answer — there is no universal "right" call, only a right call for your conversion rate.
Where the simple EV model stops working
If the math is this clean, why isn't every team going for two? Because expected points is the wrong objective late in a game — the right objective is win probability, and the two diverge hard near the end.
- Score state dominates in the fourth quarter. Down 8 with no time, you have to go for two after scoring to force overtime — the EV of points is irrelevant; you need exactly two. Up 5, you kick to go up 6 and avoid a tie. Trailing by 2, the kick that ties is worth far more in win probability than a riskier two-point try that would put you ahead but often leaves you still behind. These are the famous "two-point chart" situations, and they're decided by what number you need, not by which call averages more points.
- The 47% threshold assumes you know your rate. A team's true conversion probability is a moving target — it depends on the defense across the line, the weather, whether your short-yardage back is healthy. The break-even is a sharp number; your estimate of p is fuzzy, and a coach reasonably wants a clear edge before deviating from the safe play.
- Risk and variance are real. Expected value treats 0.94 guaranteed-ish points the same as a 52% shot at 2. But a missed two-pointer in a one-score game can be season-defining, and humans — coaches very much included — weight that downside more heavily than the model does. That's not irrationality so much as a different utility function.
- PAT rates aren't fixed either. The 94% I used is a representative number; into a stiff wind or from a struggling kicker it falls, which quietly lowers the break-even and makes going for two more attractive than the static chart suggests.
So what's the takeaway?
The expected-value math is genuinely simple and genuinely useful: it tells you the break-even is around a 47% conversion rate, and it tells you that the average college team is close enough to that line that "always kick" is leaving small but real value on the table. What the EV model can't do is make the late-game call for you — for that you need a win-probability model that knows the score and the clock, the same engine behind the win-probability graphs you see on broadcasts. Use EV to set your default in the first three quarters; switch to win probability when the scoreboard starts dictating exactly how many points you need. You can run conversion rates and game-state scenarios yourself on the Calculators hub.
Sources & further reading
- Further reading: Chapter 21: Win Probability Models, DataField.dev.
- The expected-value framework is standard decision analysis; the chart is computed directly from
EV = points × probability, with the PAT make rate and typical two-point band entered as labelled model inputs (representative of recent college rates), not pulled game data. - Related: How college football win probability models work — the model you switch to for late-game two-point decisions.
- Related: Fourth-down decision-making — the same EV-versus-win-probability tension on a different down.
- Related: Field position and expected points — where the value of a possession comes from.