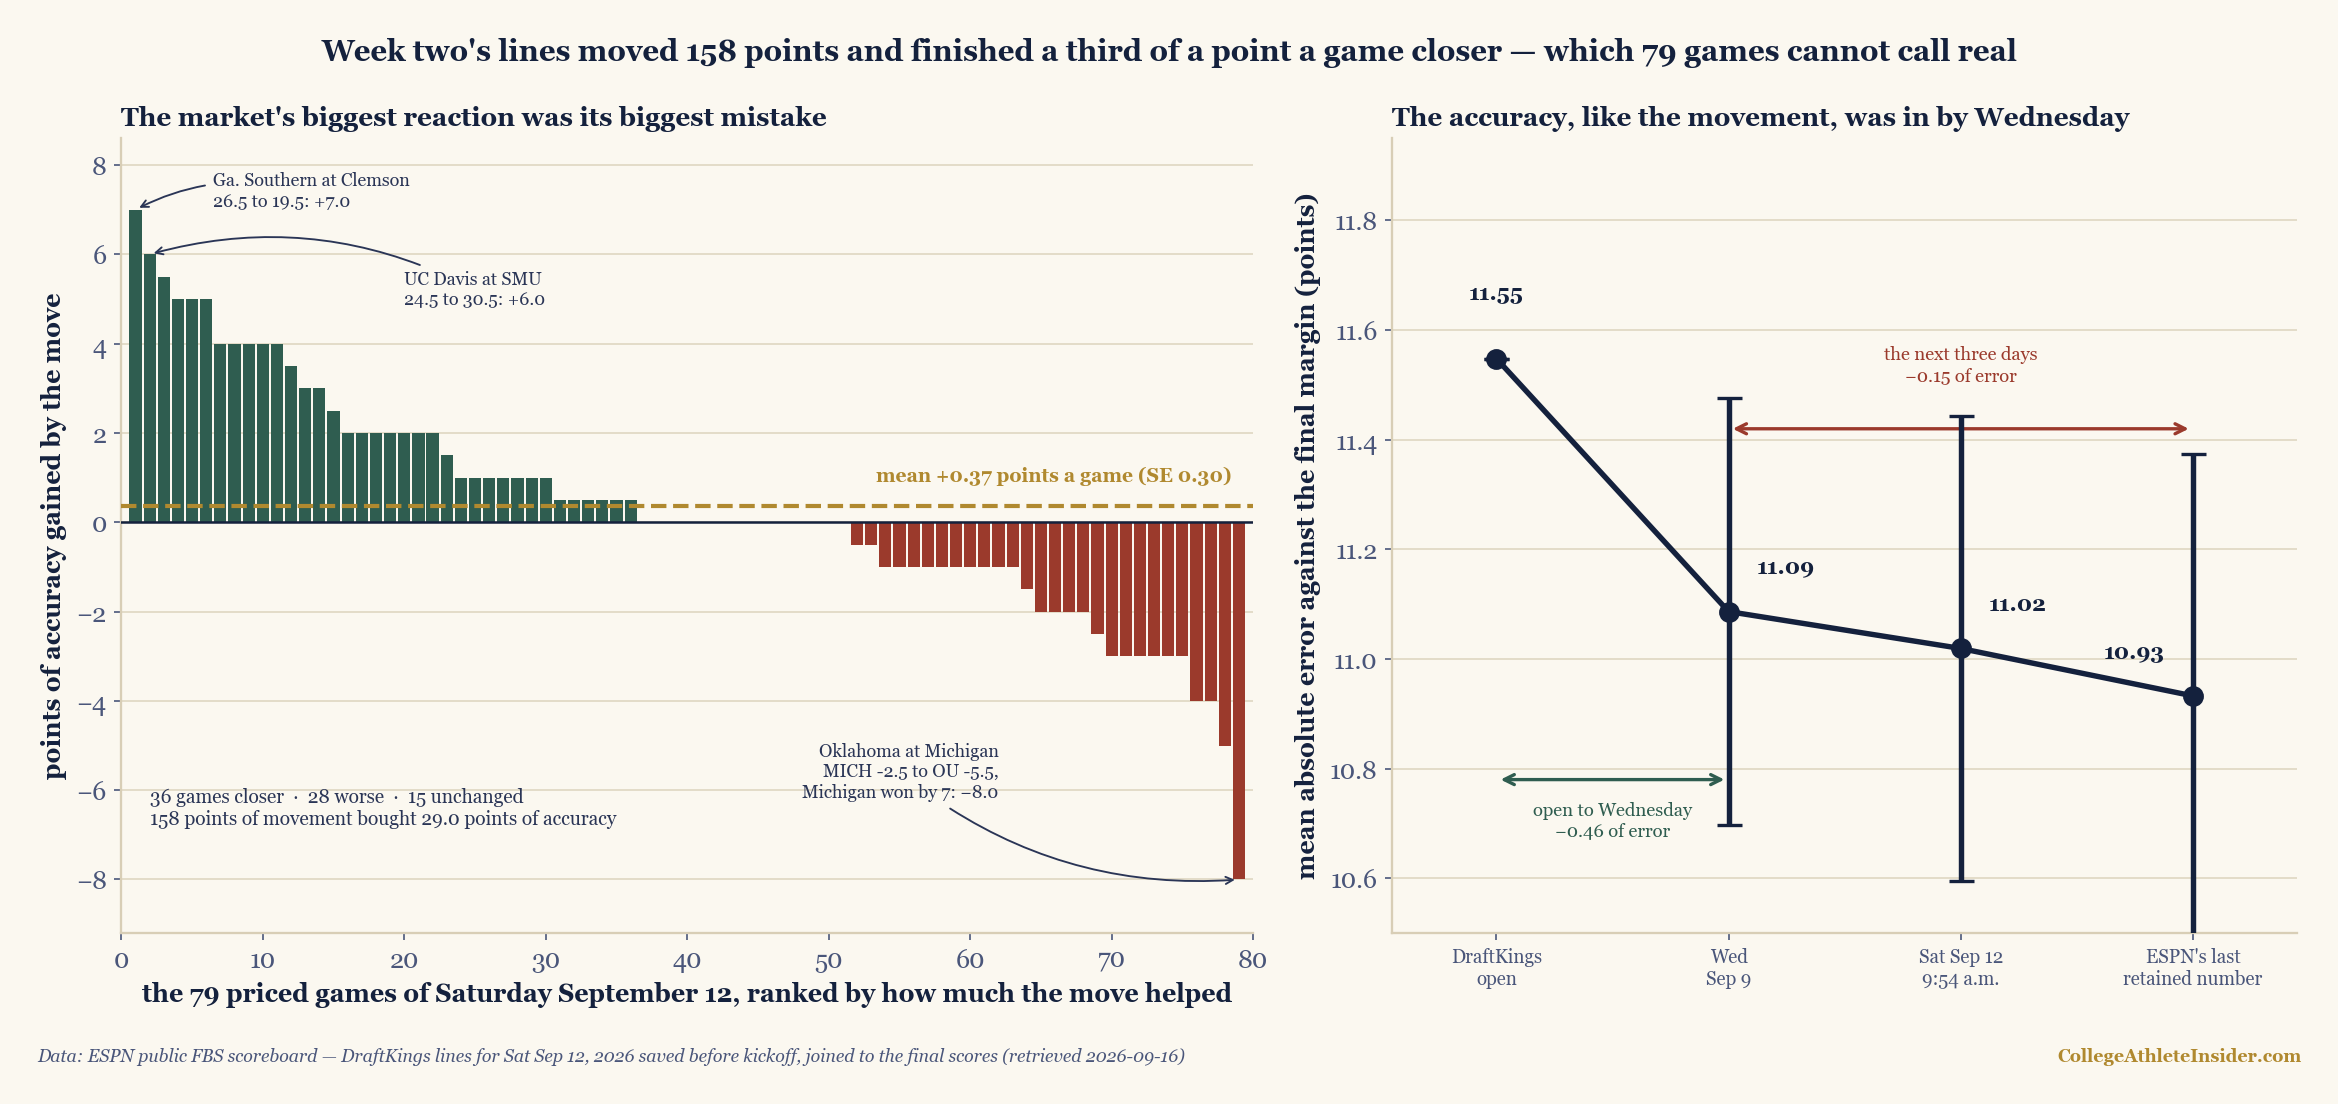
On Saturday morning I saved every price on the week-two card and argued that the market had heard week one at about a tenth of full volume. The games have since been played, which makes good on the promise that piece ended with: whichever number sat closer to the final margins was the better-informed one. The answer is that the market's reaction was worth something, and that one Saturday cannot prove it. Across the 79 priced games of Saturday, September 12, the numbers the market moved to finished 0.37 points a game closer to the results than the numbers it opened — 36 games closer, 28 worse, 15 unchanged, standard error 0.30. And the loudest single reaction on the board was its worst call: Michigan opened a 2.5-point favorite over Oklahoma, was a 5.5-point underdog by kickoff, and won by seven.
What was saved, and what ESPN kept
Three files do the work, and the order they were written in is the point. One holds the 80 Saturday games as they stood at 09:54 Eastern that morning, 126 minutes before the first kickoff, each with its DraftKings opening spread and the number then showing; its builder refuses to save anything once a game has started. A second holds the same games as of Wednesday, September 9, plus every week-one final. This morning a third pulled the final score of all 86 week-two games — one Thursday, five Friday, 80 Saturday, every one complete, none tied. All 80 join a saved price on ESPN's event id with no mismatched name, and 79 carry both an opening and a Saturday-morning spread. Alabama State at Troy never had one and is left out rather than guessed.
The results pull also corrected something in my own notes. This site has worked since September 9 on the finding that ESPN does not retain its betting blocks for past games. Four days after kickoff the scoreboard's odds block is indeed gone on all 86 — but the per-game summary endpoint still carries a pickcenter entry for every one of them, a single DraftKings line. Retention is a matter of time, not a switch, and the earlier probes that found nothing were looking at seasons, not days.
That retained line is not the one I saved. It differs from my 9:54 a.m. number on 46 of the 79 spreads and on 56 of the 80 totals, by an average of −0.22 points; of the 27 games I priced Saturday morning that had carried no line on Wednesday, it matches mine on nine. So is it a real late price or a number written afterward? A real price. It grades no better than my snapshot — mean absolute error 11.133 against 11.114, a paired difference of −0.019 (SE 0.113) — its change points at the side that actually covered in only 21 games against 24, and its correlation with the outcome is −0.034. It is the market still moving on Saturday afternoon, as the Saturday piece warned. It is also unreconstructable: a study that had not saved its own file would now be grading numbers it could not date.
charts/chart_week2_2026_grade.py — 197 checks.Did the moved number beat the opener?
Take a line's error to be the final margin plus the home-perspective spread, so a positive number means the home team beat the price. At the openers, mean absolute error across the 79 games was 11.481 points; at Saturday morning, 11.114. Root-mean-square error fell from 14.449 to 13.879. The paired gain is 0.367 points a game (sd 2.643, SE 0.297, t = 1.23), which does not clear two standard errors and would not be reported as a finding anywhere else on this site. Across the 64 lines that actually moved it is 0.453 (SE 0.367). The arithmetic of the week: 158 points of movement bought 29.0 points of accuracy, about 0.18 points of error removed per point of line moved.
The betting version is kinder to the market. Back the side each line moved toward, at the opening number, and the card goes 38–26 — 59.4% against a break-even of 52.4% at standard −110 pricing. That is a one-sided binomial p of 0.084 and a 95% interval from 47.1% to 71.6%, which contains break-even comfortably. Separating a true 59.4% from a coin by two standard errors takes about 114 games; I have 64. Graded at the Saturday number instead, the same sides go 34–29–1, which is what you would expect if the move had already priced in most of what it was reacting to.
Straight up, the movement bought nothing. Favorites were 69–9 at the openers, with one pick'em, and 69–10 at Saturday morning. Only the four games that changed favorite could differ, and they split. The move was right on Mississippi State at Minnesota (Mississippi State won 38–13) and on Ohio State at Texas, which opened a pick'em and became Texas by 1.5 before the Longhorns won 24–23; it was wrong on California at Syracuse, where Cal opened favored, became a 3.5-point underdog and won 21–18, and wrong on Michigan. On the steam test those four also split 2–2. Home teams went 45–34 against the opening number and 43–35–1 against the Saturday number; favorites 40–38 and 41–37–1.
A worked example: the biggest move on the board
Michigan opened laying 2.5 to Oklahoma and was getting 5.5 by the time I saved the card, an 8-point swing and the largest of the week. On the site's curve, Φ(spread/16), that took Michigan from a 0.5621 home favorite to a 0.3655 underdog. The Saturday piece found the market moving about 0.0939 points of line per point of week-one surprise; the two teams came in with a week-one gap of −37.0, so the rule predicted 0.085 + 0.0939 × (−37) = −3.39 points and the line moved −8.0.
Michigan won 17–10, a margin of +7. Against the opener the error is 7 + (−2.5) = +4.5; against the Saturday number, 7 + 5.5 = +12.5. The move made the price 8.0 points worse, the worst-graded move on the card, and ESPN's retained line still has OU −5.5, so nothing after 9:54 a.m. pulled it back. The overshoot the Saturday piece could not explain was, on one game's evidence, an overshoot. The largest moves the other way earned their keep: Clemson's number against Georgia Southern fell from 26.5 to 19.5 and gained 7.0 points of accuracy, UC Davis at SMU 6.0, Old Dominion at Virginia Tech 5.5.
Done by Wednesday, and graded that way too
Fifty-two games carry all four prices: open, Wednesday, Saturday morning, and ESPN's last retained number. Their mean absolute error runs 11.55 → 11.09 → 11.02 → 10.93. Measured against the open, the gains are 0.4615 by Wednesday (SE 0.3895), 0.5288 by Saturday morning (SE 0.4244) and 0.6154 at the last retained number (SE 0.4412); none clears two standard errors, and three quarters of the total arrives in the first leg. Thirty-eight of the 52 moved before Wednesday, 30 between Wednesday and Saturday, 28 after that — the later legs were busy and unproductive. Backing the late movers at the Wednesday number goes 13–17. The claim that the reaction to week one was finished by midweek survives being graded: the movement that carried information and the movement that improved the price were the same movement.
Was a tenth of a point timid?
If the market under-weighted week one, the week-one gap should still predict how teams did against their week-two numbers. Regress the error at the opening line on the gap across the 51 games where both teams played a priced opener and the slope is 0.1128 (SE 0.0957, t = 1.18, r = 0.166): about a ninth of a point of unpriced week-one signal per point of gap, sitting in the openers. Run it on the error at the Saturday number and the slope is 0.0189 (SE 0.0921, t = 0.21). The drop is an identity rather than a discovery — the market moved 0.0939 per point of gap, and 0.1128 − 0.0939 = 0.0189 — but the size of what is left is the finding. The tenth removed essentially all of the week-one signal that was sitting in the market's own opening numbers.
What 51 games can settle is worth stating exactly. The leftover slope's 95% interval runs from −0.162 to 0.199. That rules out the loud version of the underreaction story by a distance — a market that should have moved a full point per point of gap would leave a slope near 1 — and it cannot separate zero from another tenth. The preseason-poll piece asks the same question with a Bayesian weight; the honest reading is that DraftKings' answer of about a tenth is consistent with the scoreboard, and so is a slightly bolder one.
The week in bits
The information piece priced week two's 58 lines, as they stood on September 9, at 35.04 bits, and week one's 91 games at 34.83 delivering 31.21 — 89.6%. Week two grades almost identically: those 58 games delivered 31.02 bits, 88.5% of what they were priced for, 0.535 a game against 0.604 priced. Two cards of very different shape, both about a tenth short, because favorites keep beating the curve. They did it less emphatically this time: 48–10 on that card against Φ-expected 46.1, where week one's went 83–8. Across all 85 games that carried a pre-game price, favorites finished 75–10 and the card delivered 34.29 bits of 42.65.
The loudest result was not on anyone's marquee: Oregon laid 23.5 at Oklahoma State, lost 39–31, and delivered 3.817 bits against the 0.369 it was priced for. The one ranked-versus-ranked meeting, Ohio State at Texas, was priced at 0.996 and delivered 0.896 when Texas won 24–23. The 27 games priced only after Wednesday, valued at 0.277 bits apiece, delivered 0.107: their favorites went 27–0. Against opening Saturday, week two's prices were simply better — mean absolute error 11.11 to 13.52, residual standard deviation 13.77 to 16.11.
Limits
The sample is one Saturday. Every gain here sits inside its own standard error, and the honest summary is that the moved lines were probably a little better and might have been no better. The buckets are worse. Cut the 64 moved lines by move size and the steam record runs 12–12, 10–5, 9–7 and 7–2 as the moves get bigger, which looks like a pattern; with four buckets, one clears a 5% test by chance 19% of the time, and I would build nothing on it. Points, not prices: the juice is ignored throughout, so a 59.4% hit rate is worth less than it looks. One book, DraftKings as ESPN carries it, and the 9:54 a.m. number is a snapshot, not a close. The two metrics disagreed: mean absolute error and against-the-spread records answer different questions, the first weakly favoring the moved number and the second favoring it more. Class matters: the move helped 0.633 points a game across the 45 all-FBS games and 0.015 across the 34 with an FCS side — one more cut with no sample behind it. FBS membership uses the house conference-id proxy with North Dakota State and Sacramento State excluded by name, and the site's weeks are Eastern kickoff dates, September 3–7 for week one and September 10–12 for week two, because ESPN's feed numbers them differently.
Sources and reproducibility
ESPN public scoreboard, site.api.espn.com/apis/site/v2/sports/football/college-football/scoreboard?dates=YYYYMMDD&groups=80&limit=300, for final scores, and the per-game summary endpoint .../summary?event=<id> for the retention audit. Results retrieved September 16, 2026 by data_layer/build_week2_2026_results.py and saved as data_layer/week2_2026_results.json, which carries no price used in this piece. Every pre-game number comes from data_layer/week2_2026_line_moves.json (13:54 UTC, September 12, before kickoff) and data_layer/weeks_1_2_2026_lines.json (September 9). All figures are recomputed at every site build by charts/chart_week2_2026_grade.py, which runs 197 checks, including the binomial and both regressions, and refuses to draw the chart if one fails. The probability curve is from the point-spread piece, the entropy measure is Claude Shannon's 1948 quantity, and the calculators page converts any line the same way.
The useful thing about writing a number down before the games is that it can embarrass you afterward. This one mostly did not: the market's week-one lesson was worth about a third of a point a game, it was learned by Wednesday, and by Saturday morning there was almost nothing left in the openers for week one to explain. The embarrassment is concentrated in one game — the biggest move of the week, the one that gave the argument its headline, was the one the scoreboard threw out.