Every March, somebody fills out a bracket, picks all four No. 1 seeds to reach the Final Four, watches a 12-seed bury a 5, and concludes the tournament is chaos. It isn't — not really. Single-elimination basketball is one of the most legible random processes in sports, and the seeds carry real information about win odds. The trouble is that our intuition about "how often the favorite should win" is badly calibrated, so genuinely likely upsets feel like miracles. Let me lay out what a seed difference actually implies, why upsets happen more than they feel like they should, and how variance compounds across a six-round bracket. Then you can run your own field through a simulator at the bottom and watch the math breathe.
The one-sentence version: a seed line is a rough rating, a rating gap maps to a win probability, and stacking six of those probabilities in a row guarantees that "unlikely" things happen constantly.
A seed is a compressed rating
When a committee hands out seeds 1 through 16 in each region, it is really sorting teams by perceived strength and then chopping that continuous ranking into lines. A 1-seed isn't categorically a different species from a 2-seed; it's a team the committee judged a little better, given a slightly easier road. The honest way to read a bracket is to translate each seed back into the underlying strength it stands for, because win probability depends on the gap between two teams, not on the labels.
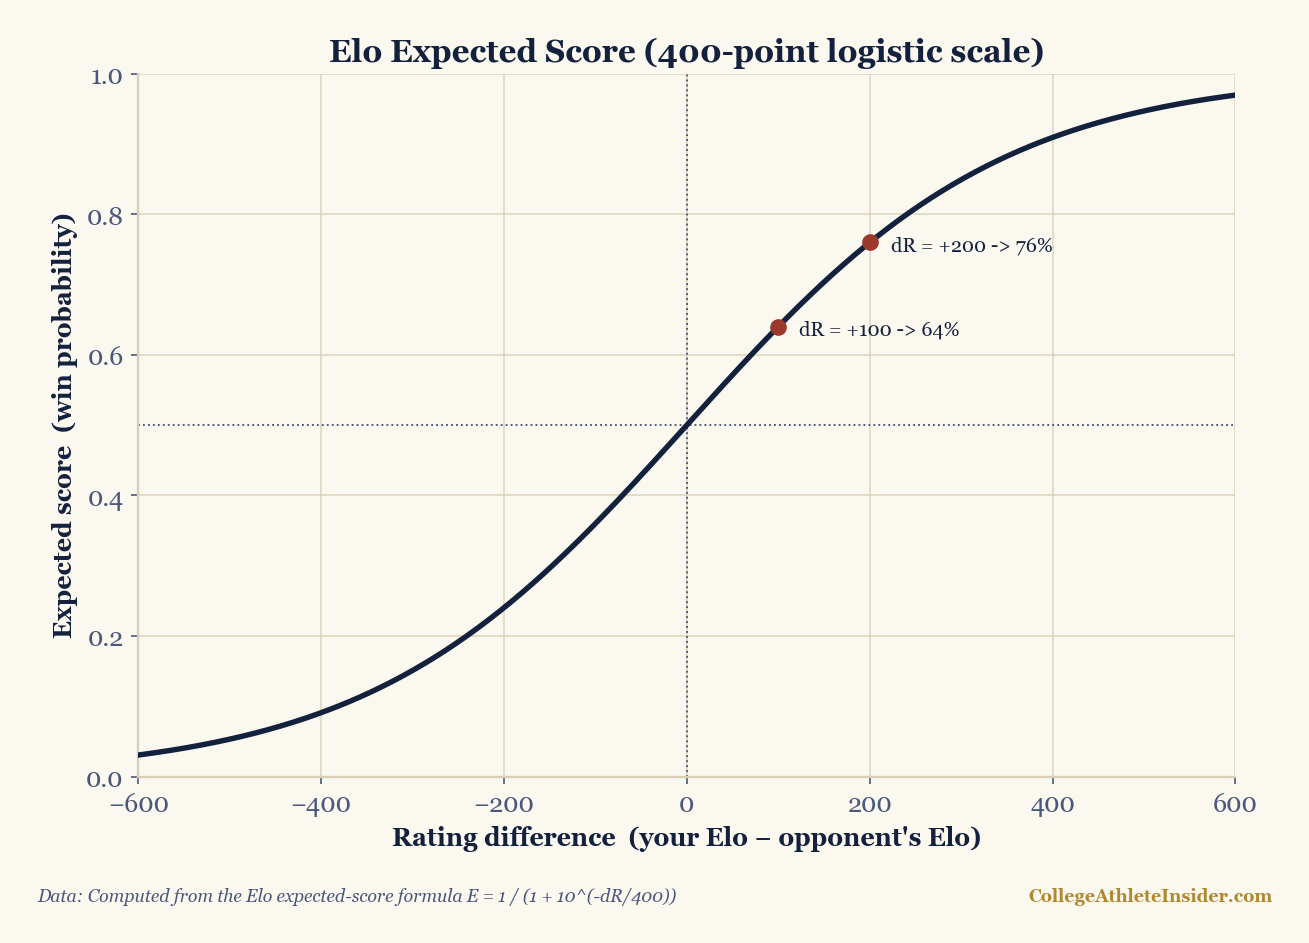
The cleanest tool for that translation is the same logistic curve that powers Elo and most power ratings. If two teams differ by ΔR rating points, the stronger team's win probability is:
P(win) = 1 / (1 + 10−ΔR/400)
The 400 is a scaling constant: a 400-point edge makes you a roughly 91% favorite, 200 points about 76%, 100 points about 64%, and a gap of zero is a coin flip. The exact rating values attached to seed lines vary by season and by rating system, so I won't pretend to a precise "a 1-seed is exactly X points better than a 16." What matters is the shape: win probability is a smooth, saturating curve, not a cliff. Small rating gaps barely move the odds off 50%; only large gaps push you toward near-certainty.
What a seed difference implies
The seed numbers are evenly spaced, but the talent behind them is not. The drop from a 1-seed to a 2-seed is small; the drop from a 2 to a 7 is larger; the drop from an 8 to a 9 is almost nothing, which is exactly why the 8-vs-9 first-round game is famously close to a coin flip. Two lessons fall out of this.
First, equal seed-number gaps are not equal probability gaps. A 4-seed beating a 1-seed is a different proposition from a 13-seed beating a 10-seed, even though both are "three seed lines apart," because the rating distance between the elite lines is compressed near the top.
Second, a single game is a small sample. Basketball has enough possessions for the better team to usually win, but not enough to make it reliable. Even a clear favorite who would win a best-of-seven handily can drop one game out of three or four. The tournament is built entirely out of these one-game samples, which is the whole source of the madness.
Why upsets feel rarer than they are
Here is the cognitive trap. Suppose a favorite is a 75% pick in a given game — a comfortable edge most fans would describe as "should win." That also means the underdog wins one time in four. Across a first-round slate of many such games, several favorites going down is not an anomaly; it's the expected outcome. We notice each individual upset as a shocking event and never tally the dozens of games where the favorite quietly held, so the base rate of "a 75% favorite loses" feels far smaller than its true 25%.
The famous 12-over-5 first-round result is the cleanest example. There is nothing magical about the matchup; it's simply that the 5-seed and 12-seed are often closer in true strength than their four-line gap suggests, so the "upset" is really just a moderate favorite losing a coin-flippish game at a normal rate. Over a long history of tournaments, that game has gone the underdog's way often enough that calling it an upset is half a misnomer.
Contrast that with the 16-over-1 first-round game. The rating gap there is large enough that the favorite's win probability sits very high, so the upset is genuinely rare — but "rare" is not "impossible," and a smooth probability curve says that given enough tournaments, it eventually happens. It has. The lesson isn't that anything can happen equally; it's that low-probability is not zero-probability, and you get a lot of independent chances.
Variance compounds in single elimination
The deepest reason a bracket is so unpredictable is that you have to survive a chain of games, and probabilities multiply. Say a strong 1-seed is, optimistically, an 80% favorite in every single game it plays. To win four games and reach the Final Four it must string together four wins: 0.80 × 0.80 × 0.80 × 0.80 ≈ 41%. To win all six and cut down the nets: 0.806 ≈ 26%. And that's with a fantasy-grade 80% in every round, which no real team enjoys deep into the bracket, because the opponents get better as the rounds advance and each game's win probability slides back toward a coin flip.
This is why even the best team in the country is usually an underdog to win the title outright — not against any one opponent, but against the field. The most likely single champion might be a 1-seed at, say, one-in-five odds, while "some team other than the favorite" collectively holds the other four-in-five. Multiply six independent-ish survival probabilities and the strongest team's path to the trophy is narrow even when no single game looks like a toss-up.
It also explains why a bracket is so hard to fill out perfectly. The number of games is large, each carries real uncertainty, and the errors compound: one early miss cascades through every later round that depended on it. A perfect bracket isn't merely unlikely, it's astronomically so, and that's a direct consequence of multiplying many sub-certain probabilities together.
Run the numbers yourself
Reading about compounding variance is one thing; watching it is better. The simulator below takes a field of 8 to 16 teams, each with a rating you choose, and plays out thousands of random single-elimination tournaments. Every game is decided by that same Elo logistic on the rating gap, and the tool reports each team's title odds plus one sample bracket so you can see a single tournament's bracket-busting path.
Try the built-in example first, then experiment: give your top seed a commanding rating edge and notice that its title odds still usually land well under 50%, because it has to win every round. Then tighten the ratings toward each other and watch the odds flatten into near-chaos. That gap between "clearly the best team" and "likely champion" is the entire emotional engine of March, quantified.
One honesty note before you start: this is a model built from the ratings you type in. It invents no real teams, scrapes no data, and predicts no actual tournament. It is a sandbox for the math above — a way to feel how seed gaps and single-elimination variance interact, nothing more.
Try it yourself
Put the formula from this piece to work on your own numbers. It runs entirely in your browser — nothing is sent anywhere. For the full set, see the Calculators hub.
Bracket simulator (single elimination)
Enter your own field of 8–16 teams with a rating each. The tool runs thousands of random single-elimination tournaments — each game decided by the Elo logistic on the rating gap — and reports every team's title odds with one sample bracket. It is a model built from your inputs, not a prediction of any real tournament.
A projection from your own ratings, run as random simulations. Not a forecast of any real bracket; no real team is named or result invented.
Sources & further reading
- Background reading: Chapter 8: Probability: The Foundation of Inference, a free textbook chapter at DataField.dev.
- Elo win-probability logistic — the standard
1 / (1 + 10−ΔR/400)formula used across rating systems - Related: Bracketology and the seeding process, explained · A statistical profile of March Madness upsets
- Build it from scratch: A Monte-Carlo bracket simulator in Python