The number everyone quotes about the new revenue-sharing era is $20.5 million — the amount a school could pay its athletes directly in year one (2025-26) under the House settlement; the cap steps up to roughly $21.3 million for 2026-27 under the settlement's built-in escalator, and the worked example below keeps the year-one figure because the arithmetic is the point. That number is the easy part. The hard part, the part that will quietly decide which programs win, is the sentence nobody puts on a graphic: how do you divide it? A cap is one figure. A roster is a hundred-plus people playing a dozen sports, and the same $20.5 million split two different ways builds two completely different athletic departments. This piece is about that split — how the money flows from the top line down to an individual quarterback — and why the allocation, not the cap, is the real strategy.
The disclosure up front, because it matters here more than usual: the $20.5 million year-one cap is a real, publicly reported figure, and the broad sport-by-sport split below tracks what athletic directors have described to reporters. The per-position dollar figures are a clearly-labelled illustrative model — a reasonable worked example, not any real school's actual contracts, which are private. The arithmetic on the model is exact. This is information, not advice, and the rules are still moving.
Step one: split the pool by sport
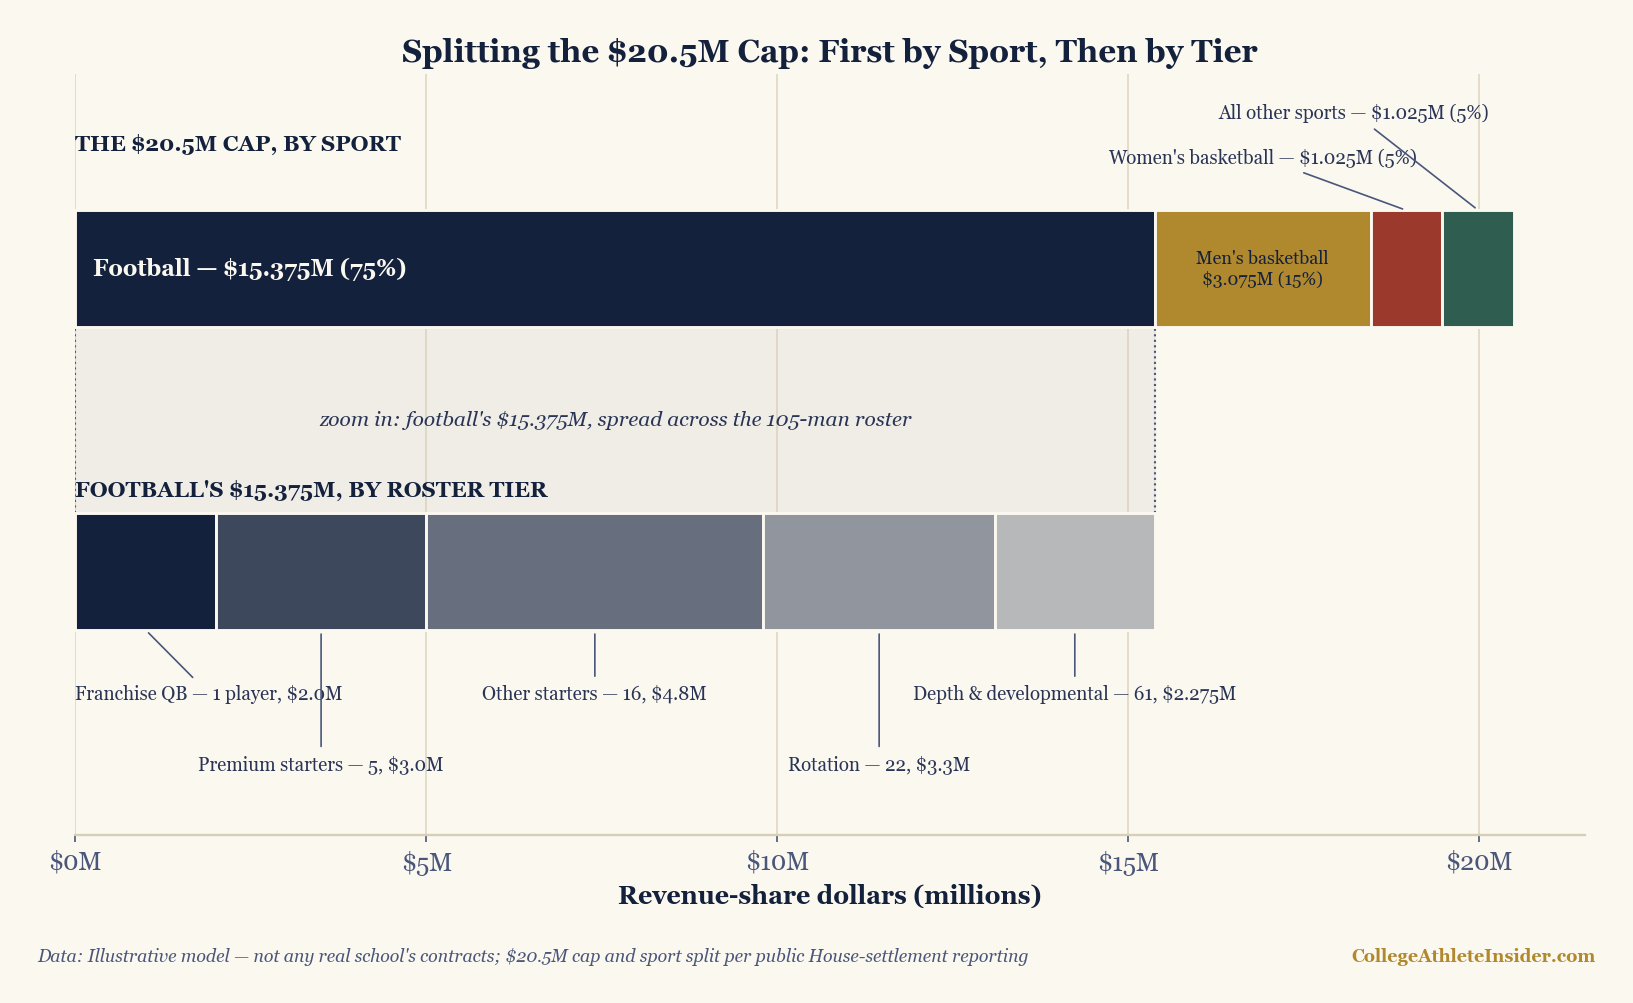
The first cut is across sports, and it is brutally uneven because the revenue is uneven. Football and men's basketball generate almost all of the money, so at the big football schools they take almost all of the pool. The allocation athletic directors have most commonly described looks roughly like this:
| Sport | Share | Dollars |
|---|---|---|
| Football | 75% | $15,375,000 |
| Men's basketball | 15% | $3,075,000 |
| Women's basketball | 5% | $1,025,000 |
| All other sports | 5% | $1,025,000 |
Look at that bottom row. Every other varsity sport — baseball, softball, volleyball, soccer, track, wrestling, the entire Olympic-sport apparatus — is dividing about a million dollars, while football alone works with fifteen. That is the first place the cap becomes a values statement rather than an accounting entry, and it is where the Title IX fights will be fought, because the split above pays men's revenue sports the overwhelming majority. Whether a formula this football-heavy survives contact with gender-equity law is genuinely unsettled as of the middle of 2026, and I would not bet on these exact percentages holding.
Step two: split the football pool by position
Now zoom into the $15.375 million football pool and the real chess begins. A roster is not a flat payroll; it is a market with wildly different prices by position and by tier. Here is an illustrative build that spends the whole football pool across a 105-man roster — the new limit that replaced the old scholarship cap:
| Tier | Players | Each (approx.) | Tier total |
|---|---|---|---|
| Franchise quarterback | 1 | $2,000,000 | $2,000,000 |
| Premium starters (edge, CB, WR, LT) | 5 | $600,000 | $3,000,000 |
| Other starters | 16 | $300,000 | $4,800,000 |
| Rotation players | 22 | $150,000 | $3,300,000 |
| Depth & developmental | 61 | ~$37,000 | $2,275,000 |
The line that jumps off the page is the top one. A single franchise quarterback in this model earns $2 million — about as much as the bottom 61 players on the roster combined, and about two-thirds of the entire men's basketball pool. That is not a distortion of the model; it is the model telling the truth about football. One position touches the ball on every snap and has no substitute of remotely equal value, so a rational market prices it like a franchise. Load up on a great quarterback and you have spent an eighth of your football money before you have signed anyone else. This is the arithmetic behind the transfer-portal quarterback carousel: the price of the position is now an explicit line item, not a booster's handshake.
Notice, too, that the shape of the spend is a choice. The build above is top-heavy — a few enormous salaries and a long tail of small ones. A different staff could flatten it: no $2 million quarterback, but deeper, more competitive money through the two-deep, betting that roster depth and continuity beat one star. That is a real strategic fork, and the cap forces every program to pick a side of it.
Why the allocation is the whole game
Here is the thing the $20.5 million headline hides: within a conference, most contenders will be at or near the same cap. If everyone spends roughly the same total, then how you spend it is the only lever left. The program that correctly identifies which positions win games and prices them accordingly — and, just as importantly, refuses to overpay the positions that don't move the needle — will out-roster a rival with the identical budget. Salary-cap management, the discipline that has decided the NFL for thirty years, has just arrived in college football, and most athletic departments are building the muscle from scratch.
It interacts with everything else on this site's business beat. A cap-driven roster still gets supplemented by third-party NIL collectives, which sit outside the $20.5 million and are now subject to a clearinghouse review for “fair market value” — so the true spend per player is the revenue-share figure plus whatever legitimate NIL a player lands, and the two have to be managed together. It reshapes roster construction under the new 105-man limit, where a walk-on now occupies a scholarship-equivalent slot that could have gone to a paid contributor. And it all rests on the framework laid out in the House settlement explainer, which is the document that created the cap in the first place.
Where this model is wrong on purpose
I built the tables to teach the structure, and they simplify hard. The honest limits:
- The per-position dollars are invented for illustration. Real contracts are private, individually negotiated, and vary enormously by program and by player. Do not read “$300,000 for a starter” as a market rate — read it as one internally consistent way to spend the pool. The shape is the lesson, not the digits.
- The sport split is contested and school-specific. The 75/15/5/5 pattern reflects football-first power programs; a basketball school, or a school under a stricter reading of Title IX, would look nothing like it. This is the single most legally uncertain number in the piece.
- The cap itself escalates and is disputed. The $20.5 million is the first-year (2025-26) figure — it rises to roughly $21.3 million for 2026-27 and keeps climbing — and the settlement's terms — backpay, enforcement, the collectives clearinghouse — are being litigated and lobbied in real time. Anything here can move.
- “Position value” is itself a model. Pricing quarterback above tackle above safety embeds a theory of what wins football games. It is a defensible theory, but it is a theory, and a staff that prices positions differently is making a real bet, not an error.
None of that undoes the core point. The cap is a ceiling every serious program will bump against; the allocation beneath it is where the actual competition now lives. The school that treats $20.5 million as a payroll to be optimized — by sport, by position, by tier — rather than a number to be maxed out will build the better roster on the same money. The headline is the cap. The strategy is the split.
Sources & further reading
- See also Chapter 5: Supply and Demand (DataField.dev).
- The $20.5 million first-year cap and the sport-allocation patterns are from public reporting on the House v. NCAA settlement (Yahoo Sports, ESPN, On3, and Sportico coverage, 2025–26)
- The per-position dollar figures are a clearly-labelled illustrative model built to sum to the football pool — not any real school's contracts, which are private
- House v. NCAA settlement documents — the source of the cap, the 105-man roster limit, and the collectives clearinghouse
- Related: The revenue-sharing era, explained · NIL collectives · Roster economics 101 · The transfer portal, quantified