Here is the box score of the 2025 men's national championship, stripped to its bones. Houston took 16 more shots than Florida. Houston committed four fewer turnovers. Houston grabbed 15 offensive rebounds to Florida's 8, nearly doubling the Gators on the glass. By any count of opportunities, Houston ran the better night. Houston lost, 65–63.
That sentence ought to bother you, because it bothers the way most people talk about basketball. We praise the team that shoots more, rebounds more, turns it over less. Houston did all three and went home without the trophy. The reason is the single most useful idea in basketball analytics, and the 2025 final is about the cleanest demonstration of it I have ever charted: extra chances are only worth what you do with them. Florida won the one thing that turns chances into points — it shot better and got to the line — and that one thing outweighed everything Houston won.
The finding, in one chart
The cleanest way to take a basketball game apart is Dean Oliver's four factors: shooting, turnovers, offensive rebounding, and free-throw rate. They are the four levers that move offensive efficiency, and Oliver weighted them in that order — shooting matters most, free throws least. I pulled the real box score for the title game (ESPN's public API, game ID 401746082) and computed all four for both teams. The result is the whole story in one picture.
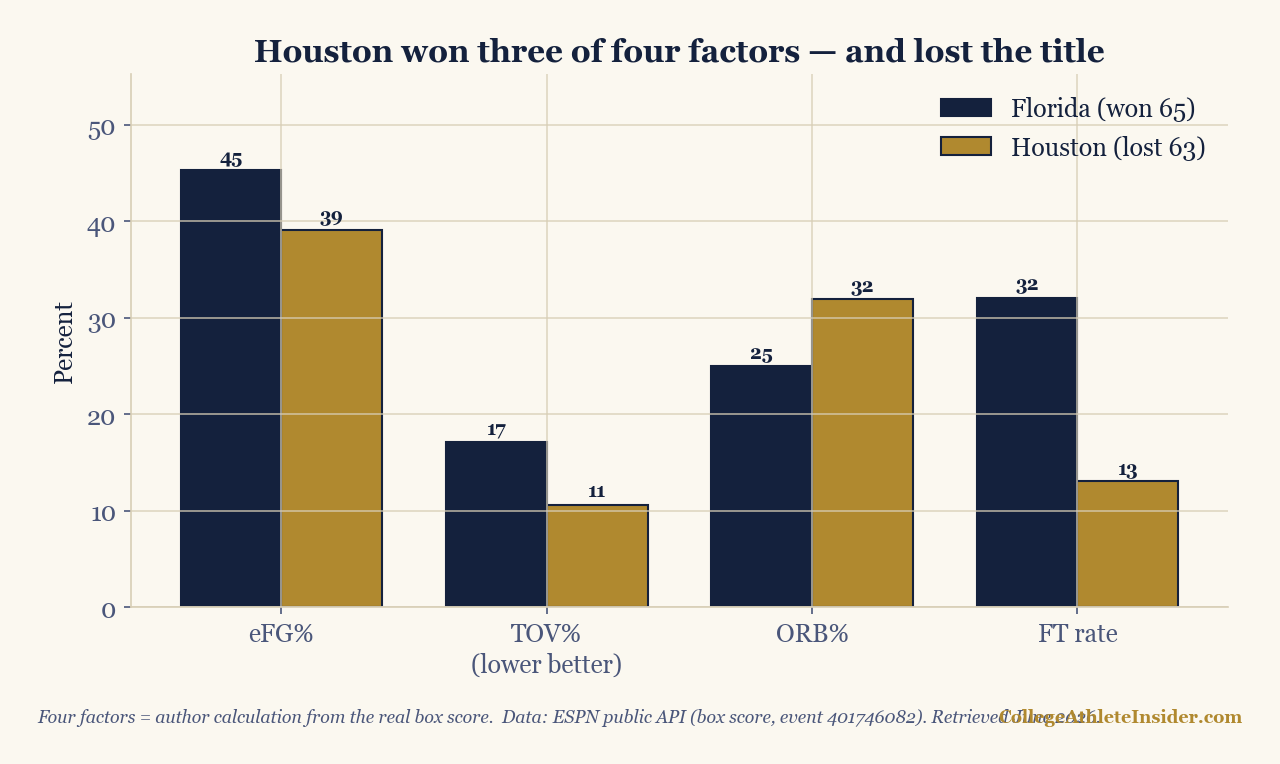
Read it left to right. On turnover rate, Houston is cleaner (10.6% of possessions to Florida's 17.1%). On offensive-rebound rate, Houston is dominant (31.9% to 25.0%). Those are the two bars where the gold beats the navy. But on effective field-goal percentage — the factor Oliver weights most heavily — Florida pulls clear, 45.3% to 39.1%. And on free-throw rate, it isn't close: Florida 32.1, Houston 13.0. Houston won the two cheap factors and lost the two expensive ones.
The worked example, end to end
Nothing here is a black box. Here is every number, computed from the box score line you could read off any broadcast.
Effective field-goal percentage credits a made three as 1.5 makes, because it is worth 1.5 times a two:
eFG% = (FGM + 0.5 × 3PM) ÷ FGA
Florida went 21-of-53 from the floor with 6 threes: (21 + 0.5×6) ÷ 53 = 24 ÷ 53 = 45.3%. Houston went 24-of-69 with 6 threes: (24 + 3) ÷ 69 = 39.1%. Houston made three more field goals than Florida — but needed 16 more attempts to do it. That gap is the game.
Turnover rate is giveaways per possession:
TOV% = TO ÷ (FGA + 0.475 × FTA + TO)
Florida 13 ÷ (53 + 0.475×21 + 13) = 13 ÷ 76.0 = 17.1%. Houston 9 ÷ (69 + 0.475×14 + 9) = 9 ÷ 84.7 = 10.6%. Houston protected the ball better — a real, earned edge.
Offensive-rebound rate is the share of your own misses you recovered, measured against the other team's defensive rebounds:
ORB% = OREB ÷ (OREB + opponent DREB)
Florida 8 ÷ (8 + 24) = 25.0%. Houston 15 ÷ (15 + 32) = 31.9%. Houston is famous for this, and it showed: nearly a third of its misses came back for another try.
Free-throw rate measures how reliably you turned the offense into points at the line:
FT rate = FTM ÷ FGA
Florida 17 ÷ 53 = 32.1. Houston 9 ÷ 69 = 13.0. Florida made 17 free throws to Houston's 9 — an eight-point swing from the line alone, in a two-point game.
Why the cheap factors are cheap
Here is the part the raw box score hides. Houston's 15 offensive rebounds felt like control. What they actually bought was extra possessions — and Houston spent those possessions at a 39% shooting clip. An offensive rebound is a fresh chance, and a fresh chance at a cold shooting night is worth a cold shooting night. Houston turned its rebounding edge into more shots, and more shots at that percentage simply piled up more misses for the same point total.
Translate it all into one number and the picture resolves. Offensive efficiency — points per 100 possessions — folds every factor into a single rate:
efficiency = 100 × points ÷ possessions
| Team | eFG% | TOV% | ORB% | FT rate | Off. eff. |
|---|---|---|---|---|---|
| Florida (won 65) | 45.3 | 17.1 | 25.0 | 32.1 | 95.6 |
| Houston (lost 63) | 39.1 | 10.6 | 31.9 | 13.0 | 90.5 |
Both teams played to about 69 possessions, so this was a normal-tempo game, not a slow one — the rock-fight feeling came from defense, not pace. Florida scored 95.6 points per 100 possessions; Houston 90.5. Both are far below the roughly 106 the average Division I offense managed in 2024–25, which is what two elite defenses do to you. But Florida was the more efficient team by about five points per 100, and the reason is exactly the two factors it won. Shooting plus free throws beat rebounding plus ball security, because the first pair scores and the second pair only sets up the chance to.
What this does and doesn't prove
I want to be careful about what one box score can carry, because it is exactly one game.
- This is a single game, not a season. Four factors are most honest aggregated over a full schedule, where a cold shooting night regresses. On any given night the better team can shoot 39% and lose; that is March, and it is why the tournament is thrilling and the regular-season ratings are more predictive. Do not read "Florida was the better offense in 2025" out of one final — read "on this night, shooting beat rebounding."
- These are raw factors, not opponent-adjusted. Florida's 45.3% eFG came against Houston's defense, which led the country in defensive efficiency; against a soft defense the same offense posts a far prettier number. To compare across teams fairly you must adjust for the opponent, the iterative idea behind adjusted tempo and efficiency and the NCAA's own NET ranking. Raw factors describe what happened in this game; adjusted factors estimate who is better.
- Possessions are an estimate. The
FGA − OREB + TO + 0.475×FTAformula is a tight approximation, not an exact play-by-play count, and the 0.475 free-throw coefficient is a league-fit constant, not a law of nature. The efficiency figures are good to roughly a possession, not to the decimal. - The factors aren't independent. Chasing offensive rebounds can leak transition defense; forcing the tempo can raise your own turnover rate. The four factors describe outcomes, not a costless menu of choices.
Reproduce it yourself
Every number above comes from one script, scripts/what-efficiency-says-about-the-2025-champion.py, which reads the game's box score from ESPN's free public API and prints the four factors and the efficiency table you see here. The four-factor formulas are the standard Oliver definitions; the possession and efficiency formulas are the same ones in the adjusted-efficiency guide. If you want the season-long version of this analysis across every team, the four-factors-in-Python tutorial walks through computing them over a full set of box scores. The same opponent-adjustment logic shows up on the football side as success rate and EPA — see what success rate and EPA actually measure for the gridiron cousin of "don't count plays, count what they were worth."
And if you want to feel how thin a margin five points per 100 possessions really is, run a few games through the efficiency math on the Calculators hub and watch how a couple of made free throws move the whole rate. That is what decided a national title: not who got more chances, but who scored on the ones they had.
Sources & further reading
- Free textbook: Chapter 17: Team Offensive Efficiency — the theory behind this, at DataField.dev.
- ESPN public API (box score, event 401746082) — the real 2025 championship box score behind every number here
- Dean Oliver, Basketball on Paper (2004) — the original four-factors framework and weighting
- Ken Pomeroy, kenpom.com — adjusted tempo and efficiency, the standard public ratings
- Bart Torvik's T-Rank — barttorvik.com (free adjusted ratings and four factors)
- Related: Adjusted tempo & efficiency · How the NET works · Four factors in Python · Success rate & EPA