The best offensive performance of the 2025 men's Final Four belonged to a team that lost. Duke scored 110 points per 100 possessions against Houston in the national semifinal — the highest single-game offensive efficiency any of the four teams managed all weekend — and went home anyway. The team that cut down the nets, Florida, never matched that number in either of its games. If you ranked the weekend by raw offense, the champion finishes behind the runner-up of one semifinal.
That is the puzzle the four factors are built to solve, and the 2025 Final Four is an unusually clean place to watch them work. I pulled the real box scores for all three games from San Antonio — the two national semifinals and the championship — off ESPN's free public API and computed Dean Oliver's four factors for every team. The finding is not that Florida was the most talented or the hottest-shooting team in the building. It is that Florida was the only team in the field with a positive efficiency margin across the games it played, and it won the one factor Oliver weights above all the others: shooting. Everything else was noise around that signal.
The four games, in one chart
Oliver's four factors are the four levers that move a basketball game: shooting (effective field-goal percentage), turnovers, offensive rebounding, and free-throw rate. He ranked them in that order — shooting matters most, free throws least — and the whole point of the framework is that it tells you which lever a team pulled to win. Florida (champion) and Houston (runner-up) each played two Final Four games; Auburn and Duke played one apiece. The chart below pools each team's totals over the game or games it actually played and shows all four factors side by side.
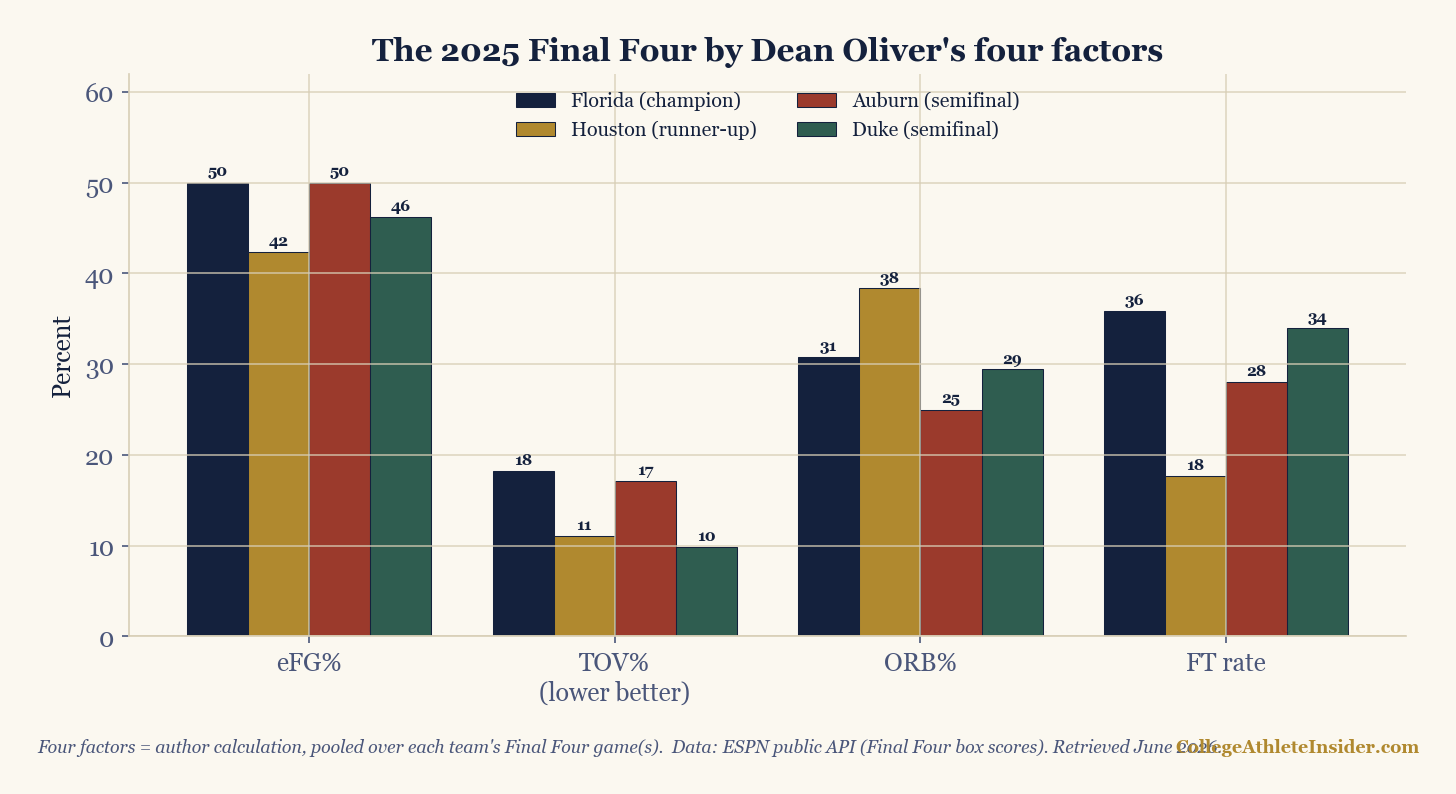
Read the leftmost cluster first, because it is the one that decided the tournament. On effective field-goal percentage, Florida and Auburn tie for the best mark in the field at 50.0, with Duke at 46.2 and Houston dead last at 42.3. Now slide right. Houston towers over everyone on offensive-rebound rate (38.4%) and has the second-cleanest turnover rate (11.0%) — it won the two factors Oliver weights least, and won them decisively. It still lost the title, because it shot worst and barely got to the line (a 17.7 free-throw rate, half of Florida's 35.8). This is the same lesson the title game taught in miniature, now visible across the whole weekend: the cheap factors filled Houston's stat sheet, and the expensive factors filled Florida's scoreboard.
Why the champion's offense looks ordinary
Here is the table behind the chart, with offensive and defensive efficiency added — points scored and allowed per 100 possessions — so you can see the full ledger.
| Team | eFG% | TOV% | ORB% | FT rate | Off. eff. | Def. eff. |
|---|---|---|---|---|---|---|
| Florida (champion) | 50.0 | 18.2 | 30.8 | 35.8 | 103.4 | 95.4 |
| Houston (runner-up) | 42.3 | 11.0 | 38.4 | 17.7 | 102.2 | 102.4 |
| Auburn (semifinal) | 50.0 | 17.1 | 25.0 | 28.1 | 100.1 | 110.9 |
| Duke (semifinal) | 46.2 | 9.9 | 29.4 | 34.0 | 110.0 | 115.6 |
Florida's offensive efficiency of 103.4 is unremarkable — it is below Duke's 110.0 and barely ahead of Houston's 102.2. What is not ordinary is the right-hand column. Florida allowed 95.4 points per 100 possessions, the only sub-100 defensive number in the field, for a net margin of +8.0. Every other team was negative: Houston −0.3, Duke −5.6, Auburn −10.8. Duke's gaudy 110 offense came with a 115.6 defense — it scored beautifully and could not get a stop. Florida was the only team that did both jobs at once, and over two games that is what a champion looks like on paper: not the prettiest offense, but the only positive ledger.
The worked example, by hand
Nothing here is a black box. Take Houston's pooled effective field-goal percentage — the factor it lost — and compute it straight from the two box scores. eFG% credits a made three as 1.5 makes, because it is worth 1.5 times a two:
eFG% = (FGM + 0.5 × 3PM) ÷ FGA
Against Duke, Houston went 23-of-61 with 10 threes. Against Florida in the final, it went 24-of-69 with 6 threes. Pool them: 47 made field goals (16 of them threes) on 130 attempts. So (47 + 0.5×16) ÷ 130 = (47 + 8) ÷ 130 = 55 ÷ 130 = 42.3%. Houston attempted 130 shots across its two Final Four games — more than anyone — and converted them at the worst clip in the field. That is the entire problem with winning the offensive-rebound battle: a rebound buys you another shot, and another shot at 42% is worth 42%.
Contrast Florida, which over its two games went 46-of-106 with 14 threes: (46 + 7) ÷ 106 = 53 ÷ 106 = 50.0%. Florida took 24 fewer shots than Houston and made nearly as many. Multiply that gap across forty minutes twice and you have the difference between a banner and a runner-up trophy. The free-throw rate compounds it: Florida converted free throws worth 35.8% of its field-goal attempts; Houston, just 17.7%. The Gators turned defense and contact into points; the Cougars turned offensive boards into more misses.
What this does and doesn't prove
I want to be careful about what four box scores can carry, because that is exactly what this is — four games, not four seasons.
- These are single games, not bodies of work. Auburn and Duke are each represented by one night; Florida and Houston by two. Four factors are most honest aggregated over a full schedule, where a hot or cold shooting night regresses. Read this as "here is what happened in San Antonio," not "here is who was the better team in 2025." Duke and Auburn were genuinely elite all year; one bad defensive night in the semifinals does not erase that.
- These are raw factors, not opponent-adjusted. Florida's 50.0 eFG was earned partly against Auburn's defense and partly against Houston's, which led the country in defensive efficiency — those are not the same test. To compare teams fairly across the bracket you must adjust for the opponent, the iterative idea behind adjusted tempo and efficiency. Raw factors describe these games; adjusted factors estimate who is better.
- Possessions are an estimate. The
FGA − OREB + TO + 0.475×FTAformula is a tight approximation, not an exact play-by-play count, and the 0.475 free-throw coefficient is a league-fit constant. The efficiency figures are good to roughly a possession, not to the decimal. - Pooling hides the matchup. Combining a team's two games into one line, as the chart does, blends a high-tempo semifinal with a rock-fight final. Houston's pooled 38.4% offensive-rebound rate is real, but it leaned heavily on the Duke game (46.2%). The per-game numbers, printed by the script, keep that nuance.
Reproduce it yourself
Every number above comes from one script, scripts/the-2025-final-four-by-the-numbers.py, which reads all three Final Four box scores from ESPN's free public API (events 401746081, 401746080, and 401746082), computes the four factors per game and pooled, and prints the table you see here. The four-factor formulas are Oliver's standard definitions; the possession and efficiency formulas match the adjusted-efficiency guide. For the title game in isolation — the cleanest single demonstration of why extra chances are worth only what you do with them — see what efficiency says about the 2025 champion. And to run the four factors over a full season of box scores rather than a weekend, the four-factors-in-Python tutorial walks through the whole pipeline.
If you want to feel how thin a margin eight points per 100 possessions really is — or how few made free throws separate a champion from a runner-up — run a few games through the efficiency math on the Calculators hub. That is what 2025 came down to: not who got the most chances, but who did the most with the ones they had.
Sources & further reading
- Chapter 17: Team Offensive Efficiency, DataField.dev.
- ESPN public API — the real 2025 Final Four box scores behind every number here: Florida 79, Auburn 73 (event 401746081); Houston 70, Duke 67 (event 401746080); Florida 65, Houston 63 (event 401746082)
- Dean Oliver, Basketball on Paper (2004) — the original four-factors framework and weighting
- Ken Pomeroy, kenpom.com — adjusted tempo and efficiency, the standard public ratings
- Bart Torvik's T-Rank — barttorvik.com (free adjusted ratings and four factors)
- Related: What efficiency says about the 2025 champion · Adjusted tempo & efficiency · Four factors in Python