"He's got the leg for it" is the vaguest phrase in football, and it hides a decision that's actually a clean piece of arithmetic. A field goal isn't a yes/no capability that switches off at some magic yard line — it's a probability that slides down a smooth curve as the kicker backs up. Once you draw that curve, the coach's real question stops being "can he make it?" and becomes "is the expected value of this attempt better than my alternatives?" That reframing is the whole game, and it's why the "range" of a kicker is a fuzzy band, not a fence.
Accuracy is a curve, not a cliff
Field-goal accuracy falls off with distance in the same S-shape that shows up all over sports modeling — the logistic curve. A compact way to write it:
P(make) = 1 / (1 + e(d − d₅₀) / s)
Here d is the attempt distance in yards, d₅₀ is the distance where the kicker is a 50/50 coin flip, and s controls how fast accuracy decays. Using representative college values — a coin-flip distance of 48 yards and a moderate decay — the model traces the shape every special-teams coordinator carries in his head.
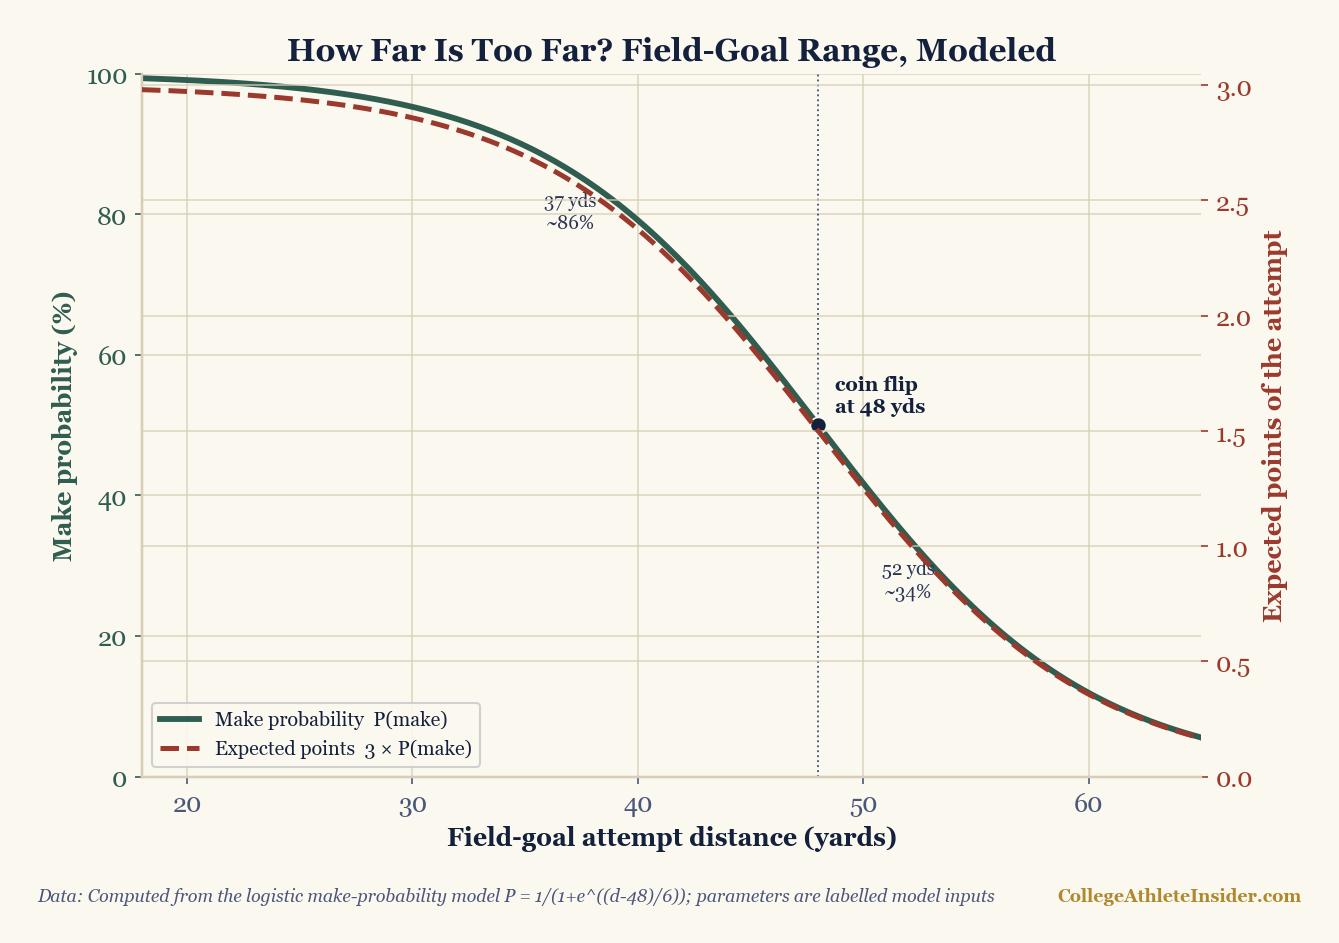
Read the green curve and the fuzziness of "range" becomes obvious. A 37-yard chip shot is about 86%. By 42 yards it's 73%. At the 48-yard coin-flip point it's exactly 50%. A 52-yarder is down to 34%, and a 55-yard try is a 24% long shot. Nowhere does the line drop vertically. "He has 55-yard range" really means "his make probability at 55 is still high enough to be worth it," which is a judgment about value, not a fact about ability.
Expected points: turning the curve into a decision
Every made field goal is worth 3 points, so the expected value of attempting one is simply:
EP(attempt) = 3 × P(make)
That's the red dashed line. It starts near 3 points for a gimme and decays with the make probability. At the coin-flip distance of 48 yards, the attempt is worth 3 × 0.50 = 1.50 expected points. At 52 yards it's down to about 1.0, and by 55 it's only 0.7. Those numbers are what a coach should actually be weighing — not the binary "can we make it," but "how many points, on average, does this try bank?"
Why the decision isn't just "kick if EP > 0"
Here's the part the simple expected-points line leaves out, and it's what makes long field goals genuinely hard calls: a missed long field goal isn't a neutral event. On a missed attempt of 40+ yards, the opponent takes over at the spot of the kick — about 7 yards behind the line of scrimmage — which is materially worse field position than a punt would have produced. So the real comparison isn't "EP of the kick versus zero." It's:
- Kick:
3 × P(make), minus the field-position cost of a miss (which grows as you back up, because the opponent gets the ball further upfield). - Punt: roughly zero immediate points, but it pins the opponent deep — a positive field-position value worth, in expected-points terms, a few tenths of a point.
- Go for it: on 4th-and-short, the conversion keeps a drive alive that's worth more than 3 points in expectation.
This is exactly why the "should we kick?" line lives in the low-to-mid 50s for most teams: that's where the kick's expected points have decayed to roughly the value a punt creates through field position, so the two alternatives break even. Beyond it, punting (or going for it) quietly wins. The break-even isn't a kicker's physical limit — it's the distance where the math stops favoring the points on the board over the field position you give up chasing them.
A worked example
It's 4th-and-6 at the opponent's 35, so a 52-yard field goal. The model says that's a 34% make, worth about 1.0 expected points. Now weigh the miss: a miss hands the opponent the ball at roughly their own 42, a clean ~15-yard field-position swing versus a punt that would have pinned them inside the 15. Against that downside, a 1.0-expected-point kick is a close call — which is precisely why you see coaches punt from the 35 and kick from the 32. Move the line three yards closer (a 49-yard try, ~47% make, ~1.4 EP) and the kick pulls comfortably ahead. The decision swings on a few yards because you're sitting right on the part of the curve where it's steepest.
Where the model stops
- The parameters are illustrative. Real kickers differ, and a single
d₅₀andscan't capture a specific leg. A booming NFL-caliber college kicker pushes the whole curve right; a shaky one pulls it left. The shape is universal; the exact numbers are not. - Conditions warp it. Wind, altitude, cold, a wet ball, and a muddy plant spot all shift the curve, sometimes by a lot. A 50-yarder into a stiff wind is a different kick than the same distance in a dome.
- Snap and protection aren't in the model. The probability above is the kick itself; blocks, bad snaps, and botched holds are a separate small failure rate the EP line ignores.
- Pressure and game state. Late-game win-probability swings can justify a low-EP attempt (down 2, time expiring, any make wins) or reject a high-EP one. As with the two-point decision, expected points sets the default; win probability overrides it at the end.
The takeaway
A kicker's "range" isn't a number — it's the place on a probability curve where the expected points of trying fall below what you'd get by punting or going for it. Drawing the curve turns a gut call into a comparison: 3 times the make probability, weighed against the field position a miss surrenders. The reason long field-goal decisions feel agonizing is that the curve is steepest exactly there, so a yard or two genuinely flips the answer. Run distances and conversion scenarios yourself on the Calculators hub.
Sources & further reading
- Chapter 21: Win Probability Models, DataField.dev.
- The logistic make-probability model is standard; the curve and the expected-points line are computed directly from
P = 1/(1+e^((d−48)/6)), with the coin-flip distance and decay entered as labelled illustrative inputs, not pulled stats. - Related: The two-point conversion decision — the same expected-value framing on a different special-teams call.
- Related: Fourth-down decision-making — kick, punt, or go, and how the alternatives are valued.
- Related: Field position and expected points — why the field position a miss surrenders has a points value.