How Lopsided Is College Football? 877 Games, Sorted by Final Margin
Just over a third of 2024's 877 cached games were one-score — and 29% were decided by 25+ points. The full margin distribution, with the cupcake games split out.
College football and basketball, men's and women's, explained with real data: advanced ratings built from scratch, the playoff and portal quantified, and a hype-free look at NIL and revenue sharing for the athletes living it.
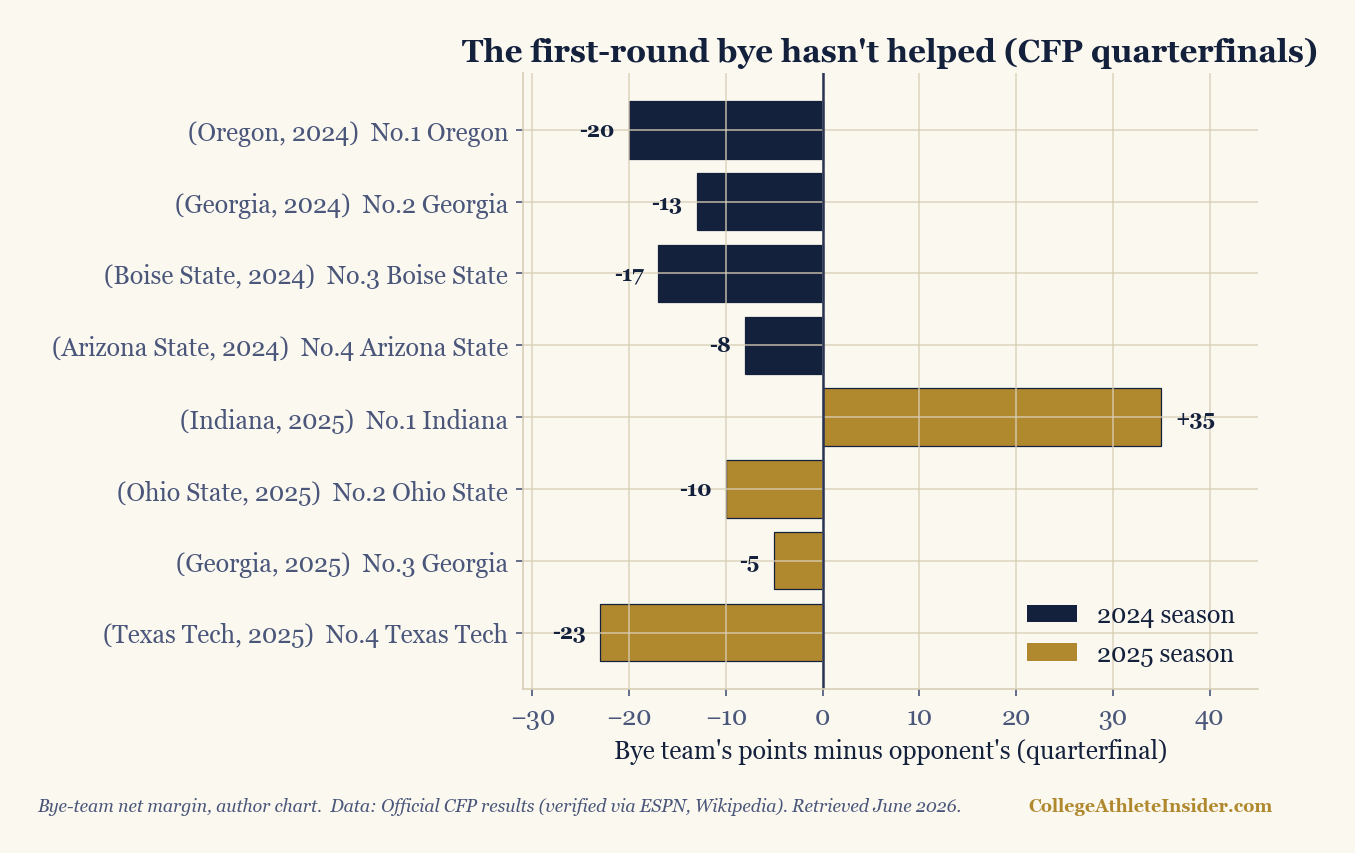
Two seasons of 12-team College Football Playoff results, scored: seed performance, byes, blowouts, and what the bracket really rewards.
Just over a third of 2024's 877 cached games were one-score — and 29% were decided by 25+ points. The full margin distribution, with the cupcake games split out.
The team with the higher scoring average entering kickoff won 67.3% of 532 cached 2024 matchups — but barely 57% when the gap was under 3 points a game.
The home team won 64% of 2024 FBS games by an average of +8.8 points, but the real home edge is about +3. Measured from 873 cached games, schedule bias split out.
The five-year clock, four seasons, the four-game redshirt window, and medical hardship tests — the eligibility math laid out, with the litigated edges flagged.
The revenue-sharing cap is one number; dividing it across a roster is the hard part. An illustrative split of a $20.5M pool by sport and position; not advice.
Leading by three late, fouling beats defending the shot — about a 90% win probability against 82.5%. The decision tree, and why coaches still won't do it.