Turn on a college football game and you'll hear it within a quarter: "his passer rating is up over 160." It sounds precise, almost scientific — one number that grades a quarterback's day. But ask the average fan what a passer rating of 160 actually means, or how it's computed, and the precision evaporates. The good news is that, unlike most advanced stats, the NCAA passer rating is not a black box. It is a single, fixed formula you can compute on a napkin from four box-score numbers. Let's write it out exactly, work an example, and then be honest about what it can't see.
The one-sentence version: NCAA passer rating is a weighted blend of yards, touchdowns, interceptions, and completions per pass attempt — a tidy, transparent formula, and a deeply limited one.
The exact formula
The NCAA passer rating (officially "passing efficiency") is defined by this formula. Every input is a season or game total; the result is a single rating:
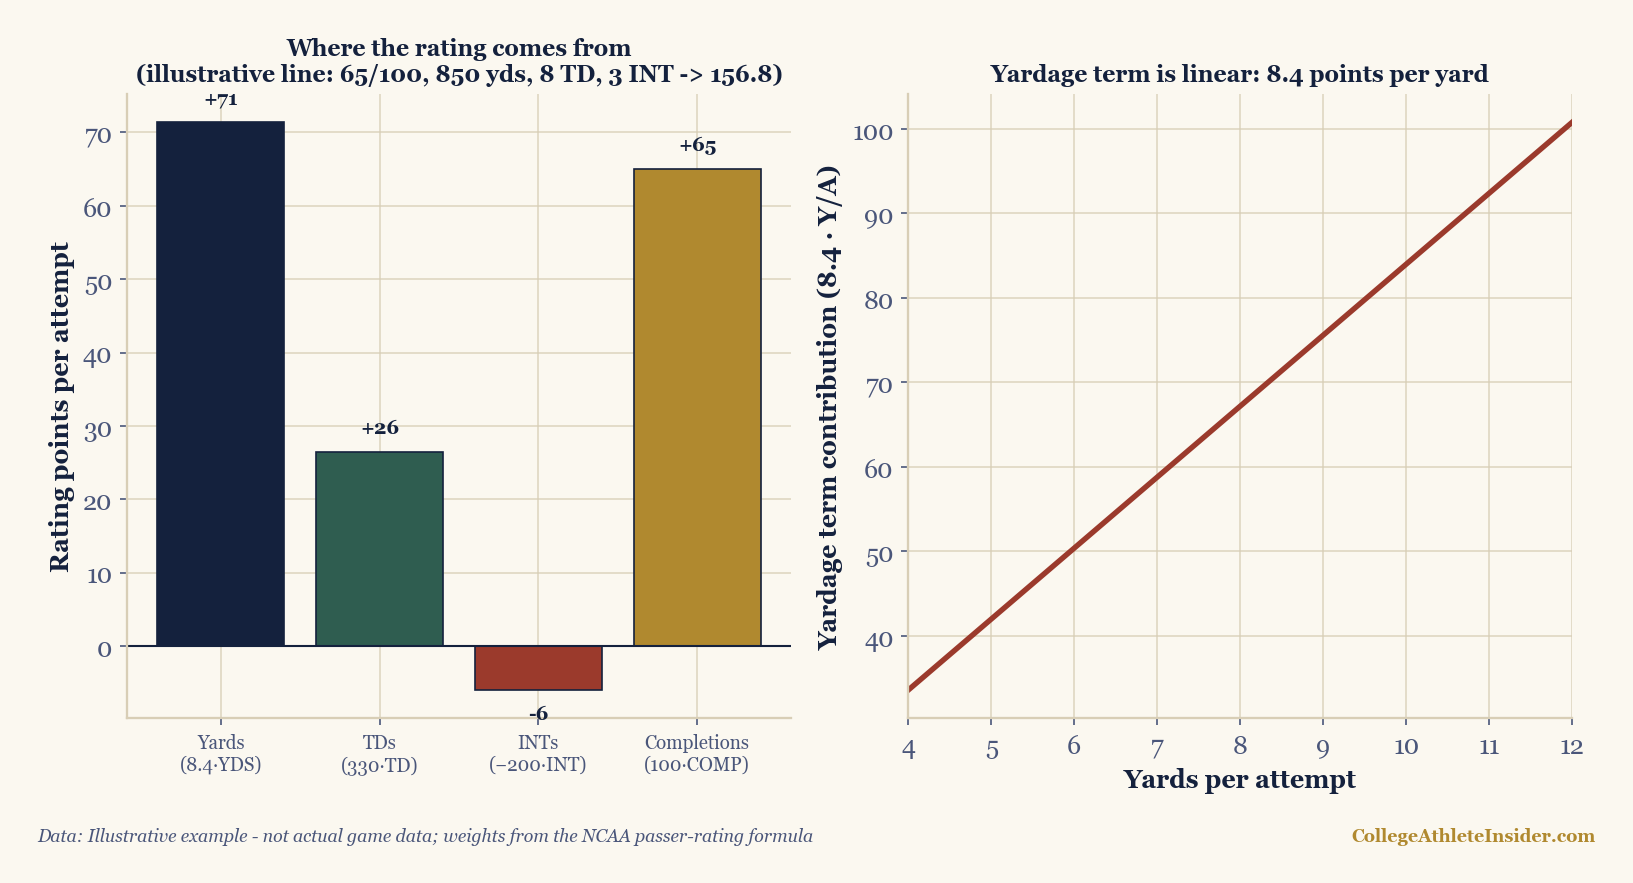
Rating = (8.4 × YDS + 330 × TD − 200 × INT + 100 × COMP) / ATT
where:
- YDS = passing yards
- TD = passing touchdowns
- INT = interceptions
- COMP = completions
- ATT = pass attempts
That's the whole thing. Notice that the entire numerator is divided by attempts, which means you can read the formula as a sum of per-attempt rates, each with its own weight:
Rating = 8.4 × (yards/att) + 330 × (TD/att) − 200 × (INT/att) + 100 × (completions/att)
Read that way, the formula's values are laid bare. Each pass attempt is graded on four things at once: how many yards it averaged, how often it scored, how often it was intercepted, and how often it was completed. The coefficients — 8.4, 330, 200, 100 — are the weights the NCAA chose for each. A touchdown is worth a flat 330 points of "credit" spread across your attempts; an interception costs a flat 200; every yard is worth 8.4; every completion is worth 100 just for being caught. Sum them, divide by attempts, and you have the rating.
What each term is doing
It's worth dwelling on the four weights, because they encode a philosophy of quarterbacking.
- 8.4 per yard rewards moving the ball. Since this multiplies total yards, it's really rewarding yards per attempt — the most fundamental passing efficiency measure. A quarterback who averages more yards per throw climbs here automatically.
- 330 per touchdown is a large bonus. Because touchdowns are relatively rare, a per-attempt touchdown rate of even a few percent adds a hefty chunk to the rating. This is why a quarterback with a high touchdown-to-attempt ratio can post an eye-popping number.
- −200 per interception is the only penalty. Interceptions drag the rating down hard, but notice the asymmetry: a touchdown (+330) is rewarded more than an interception (−200) is punished. The formula tilts toward aggression — it would rather you throw the touchdown than refuse the risk.
- 100 per completion rewards simply catching the ball. This term, divided by attempts, is essentially completion percentage times 100. It's why a high-completion, short-passing offense has a built-in floor.
Add it up and the formula's worldview is clear: it loves quarterbacks who complete a high share of passes, average a lot of yards, throw touchdowns, and avoid interceptions — with a thumb on the scale toward big plays over caution.
A worked example
Let's grade a hypothetical, clean stat line to see the formula breathe. Suppose a quarterback finishes a game with 20 completions on 30 attempts for 300 yards, 3 touchdowns, and 1 interception. (These numbers are invented to demonstrate the arithmetic, not taken from any real game.)
Plug into the numerator:
- Yards:
8.4 × 300 = 2520 - Touchdowns:
330 × 3 = 990 - Interceptions:
−200 × 1 = −200 - Completions:
100 × 20 = 2000
Sum the numerator: 2520 + 990 − 200 + 2000 = 5310. Now divide by attempts: 5310 / 30 = 177.0. So this line earns a passer rating of 177.0 — an excellent day. Walk through it and you can feel where the points came from: the 10 yards per attempt and the three scores did most of the lifting, the lone interception clawed back a little, and the 67% completion rate provided a solid base. Change any one input and the rating moves in the direction you'd expect, by an amount the weights dictate. That transparency is the formula's great virtue.
How it differs from the NFL rating
People often conflate the college number with the NFL's "passer rating," but they are different formulas that happen to share a name and four inputs. Two differences matter.
First, the math is structured differently. The NCAA version is the single linear formula above, computed in one pass. The NFL version is more convoluted: it breaks the same four inputs (completion percentage, yards per attempt, touchdown percentage, interception percentage) into four separate sub-components, and — crucially — caps each component between a floor of 0 and a ceiling of 2.375 before averaging them and scaling the result. Those caps mean the NFL rating is bounded: it cannot exceed a "perfect" 158.3, no matter how absurd the stat line. The NCAA formula has no such cap. A truly outrageous game — very high yards per attempt with multiple touchdowns — can push the college rating well past 158.3, even past 200 on a single explosive game. So identical-looking stat lines produce different numbers in the two systems, and the college number has a much wider possible range.
Second, because the NCAA formula is uncapped and weights big plays heavily, it tends to reward explosive, downfield passing more aggressively than the NFL's bounded version, which flattens out extreme performances. Neither is "right" — they're two different design choices for compressing the same four numbers into one.
The limitations
Now the honesty. A formula this simple inevitably leaves out most of what makes a quarterback good or bad.
- It ignores down and distance entirely. A 5-yard completion on third-and-3 (a conversion) and a 5-yard completion on third-and-12 (a failure) count identically. The formula has no idea whether a throw kept a drive alive — the exact blind spot that success rate and EPA were invented to fix.
- It ignores context and opponent. Yards padded in garbage time against a soft prevent defense count the same as yards earned in a tie game against a top defense. There's no strength-of-schedule adjustment of any kind.
- It ignores everything that isn't a pass stat. Sacks taken, scrambles, rushing touchdowns, fumbles, the quality of the receivers and offensive line — none of it appears. A quarterback who escapes pressure and runs for a first down gets no credit; one who takes a drive-killing sack pays no penalty in this number.
- It rewards volume-friendly profiles. Because completions and the touchdown bonus are generous, certain offensive systems (high-completion, quick-game, or heavy red-zone passing) can inflate the rating somewhat independently of the quarterback's individual quality.
None of this makes passer rating useless. As a quick, transparent, universally available summary of passing box-score production, it's genuinely handy — far better than quoting raw yards. It just isn't an efficiency stat in the modern sense, because it can't see the situation a throw happened in. Treat it as a clean headline number, then go to success rate, EPA per dropback, and opponent-adjusted measures for the real story.
How to use it
- Use it as a quick read, not a verdict. It's a fine first glance at a passing line and a terrible final word on a quarterback's value.
- Don't compare it to the NFL number. Same name, different formula, different scale — a 158 means very different things in the two systems.
- Pair it with situational stats. Down-aware measures like success rate and EPA per dropback catch the context passer rating is blind to.
- Mind the sample. Over a few attempts the rating swings wildly — one long touchdown can spike a single-game number into the stratosphere. It's most meaningful over a season.
The formula is a model of clarity: four numbers, four weights, one division. Memorize it and you'll never be mystified by a broadcast graphic again. Just remember what it leaves on the cutting-room floor — the down, the distance, the opponent, the moment — which, as it happens, is most of what actually decides football games.
Try it yourself
Put the formula from this piece to work on your own numbers. It runs entirely in your browser — nothing is sent anywhere. For the full set, see the Calculators hub.
NCAA passer rating
The official college passing-efficiency rating: four box-score numbers, four weights, one division. It is a different formula and scale from the NFL rating.
Pure math on the numbers you enter. Nothing is fetched and no real team, player, or result is named or invented.
Sources & further reading
- For the fundamentals, see Chapter 7: Advanced Passing Metrics in DataField.dev’s free textbook library.
- NCAA passing-efficiency formula — the standard definition used in official college football statistics
- Companion explainer: Success rate and EPA, from scratch
- Related: Standard downs and passing downs · Strength of schedule, explained