Two college basketball teams score 78 points. One did it in a frantic 80-possession track meet; the other in a 62-possession rock fight. Same point total, completely different offenses. Raw points per game can't tell them apart — which is why every modern basketball metric starts by throwing points per game out and counting possessions instead. Here's the whole framework, with a worked example you can reproduce.
Step one: count possessions
A possession ends when a team gives up the ball — a made shot, a defensive rebound, or a turnover. You can't always see them tallied, but you can estimate them tightly from a box score:
possessions ≈ FGA − OREB + TO + 0.475 × FTA
In English: every field-goal attempt is a possession, unless you grabbed the offensive rebound and kept it (so subtract those); add turnovers (a possession that ended with no shot); and add a fraction of free-throw attempts, because trips to the line use possessions too (the 0.475 accounts for one-and-ones, and-ones, and two-shot fouls). Because both teams have nearly the same number of possessions in a game, you average the two estimates to get the game's pace.
Step two: a real worked example
Take the April 2025 national championship — Florida 65, Houston 63 — and pull the box score (the script is scripts/adjusted-tempo-efficiency-basketball.py):
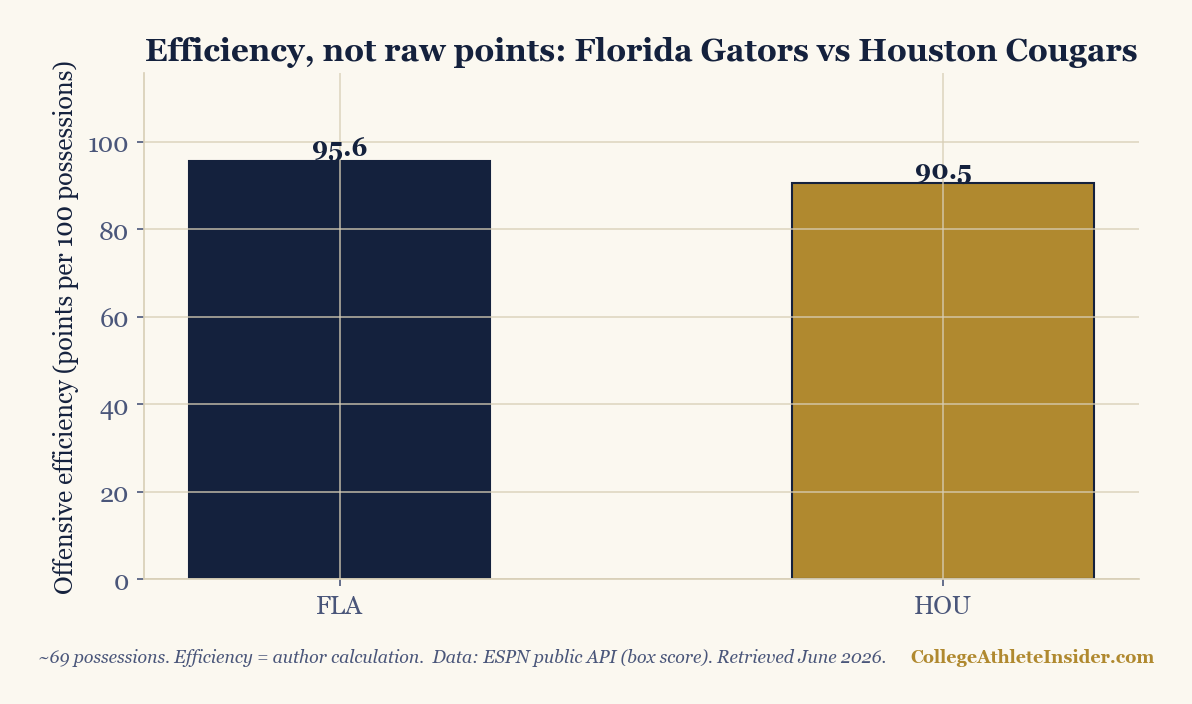
| Team | Points | Possessions | Off. efficiency |
|---|---|---|---|
| Florida | 65 | 68 | 95.6 |
| Houston | 63 | 70 | 90.5 |
Florida's number: 53 FGA − 8 offensive rebounds + 13 turnovers + 0.475 × 21 FTA ≈ 68 possessions. The game ran about 69 possessions — and for context, the average men's Division I game in 2024-25 ran about 69 possessions too, so this was a normal-tempo game. What made it a rock fight wasn't pace; it was defense.
Step three: efficiency, not points
Offensive efficiency is points per 100 possessions:
efficiency = 100 × points ÷ possessions
Florida scored 95.6 points per 100 possessions; Houston, 90.5. Both numbers are well below the national average — about 106 points per 100 in men's basketball in 2024-25 — because Houston and Florida had two of the best defenses in the country. The team that won was, by a hair, the more efficient one. Points per game would have called this a sleepy 65-63 game; efficiency correctly identifies it as a clash of elite defenses where every possession was contested.
Step four: adjust for the opponent
Here's where "adjusted" earns its name. Scoring 95.6 against Houston's defense is far more impressive than scoring 95.6 against a bad one. Adjusted efficiency recalibrates every team's raw efficiency for the quality of the defenses (and offenses) it faced — the same opponent-adjustment idea behind football's SP+ (see our SP+ explainer). The math is iterative: rate everyone, use those ratings to adjust each game, then re-rate, repeating until the numbers stop moving. The output is what powers the public ratings you've heard of and the NCAA's own NET.
The same logic gives you adjusted tempo: a team's possessions per game, corrected for the fact that opponents push or slow the pace too. A team that plays fast against slow opponents is faster than the raw number suggests.
How to use this
- Stop quoting points per game. A 85-points-per-game offense at a blistering pace can be less efficient than a 72-points-per-game offense that walks the ball up.
- Watch the four factors. Efficiency breaks down into shooting (effective FG%), turnovers, offensive rebounding, and free-throw rate — the "four factors." When a team overachieves its talent, one of those is usually the reason.
- Respect the defenses. Low-scoring isn't the same as low-quality. The 2025 title game proved it.
Once you think in possessions, you can't go back. Every box score becomes a little more honest, and "they only scored 63" turns into "they scored 90 per 100 against the best defense in America" — which is a completely different sentence.
Sources & further reading
- Free textbook: Chapter 7: Rate Statistics and Pace Adjustment — the theory behind this, at DataField.dev.
- ESPN public API (box scores) — used for the worked example
- sportsdataverse / hoopR — sportsdataverse.org (season pace and efficiency inputs)
- Bart Torvik's T-Rank — barttorvik.com (free adjusted ratings)
- Related: How the NET works · SP+ and adjusted efficiency