Every basketball team has a style, and two numbers capture most of it: how fast they play (tempo) and how much they live behind the arc (three-point rate). Plot all of Division I on those two axes and the sport's stylistic map appears — the plodding defensive grinders in one corner, the run-and-gun bombers in another. Here's how to build that chart. Full code: scripts/cbb-tempo-shot-profile-python.py.
Two numbers per team
pace            = FGA - OREB + TOV + 0.475 * FTA     # possessions per game
three_pt_rate   = 3PA / FGA                          # share of shots from deep
Average each over a team's season and you have its profile coordinates. From sportsdataverse's team box scores:
import sportsdataverse.mbb as mbb
df = mbb.load_mbb_team_boxscore(seasons=[2025]).to_pandas()
df = df[df.team_score > 0]
# per game: poss and 3PA/FGA, then average by team_display_name
Scatter the league
Plot pace on the x-axis, three-point rate on the y-axis, one dot per team, and highlight a few names:
ax.scatter(paces, three_rates, s=14, alpha=0.45)
for team in highlight:
    ax.scatter([pace[team]], [rate[team]], s=60)   # call out a few
ax.set_xlabel("Pace (possessions per game)")
ax.set_ylabel("Three-point rate (3PA / FGA, %)")
The result
Slowest 3:  North Texas 61, Drake 61, Virginia 62
Fastest 3:  Winthrop 75, Cal Poly 76, Alabama 76
Most 3-reliant 3:  William & Mary 51%, North Dakota St 53%, North Florida 54%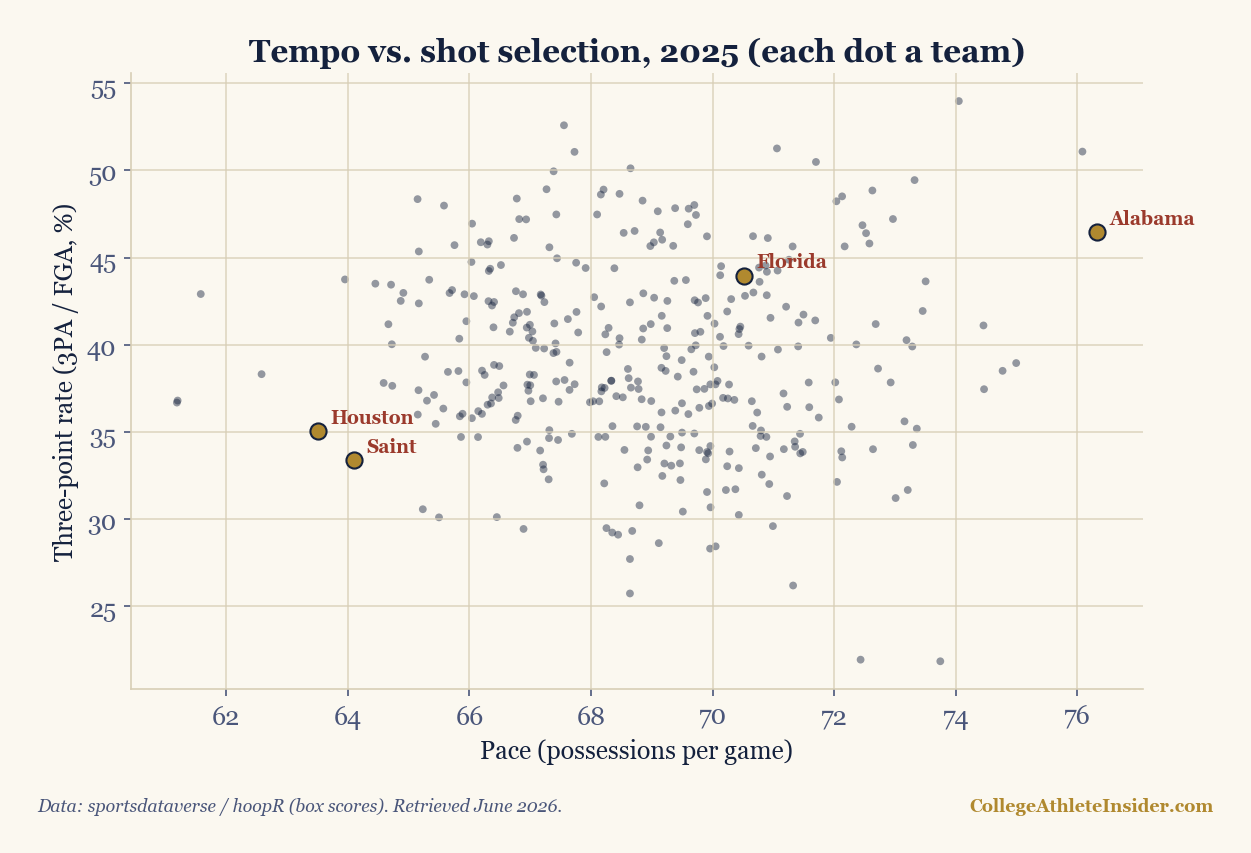
The extremes are exactly who you'd guess, which is how you know the method works: Virginia anchors the slow end (~62 possessions, the famously methodical pack-line style), while Alabama sits at the fast end (~76, a track meet). Some mid-majors push three-point rate past 50% — taking more than half their shots from deep, the ultimate variance strategy that fuels March upsets (see what upsets have in common). A team's location on this map tells you, before tip-off, what kind of game to expect.
Read the map
- Pace is not quality. Fast and slow teams can both be great; tempo is style, not strength. Pair it with adjusted efficiency.
- High three-rate = high variance. These teams have the widest range of outcomes — dangerous underdogs, frustrating favorites.
- Add a third dimension with color or size: free-throw rate, or defensive efficiency, to enrich the map.
Sources & further reading
- Background reading: Chapter 3: Python for Sports Analytics, a free textbook chapter at DataField.dev.
- sportsdataverse / hoopR — sportsdataverse.org
- Companion code:
scripts/cbb-tempo-shot-profile-python.py - Related: The four factors · Tempo and efficiency, explained