If you built the football Elo, you already know the engine — and the beautiful thing about Elo is that it ports to any sport unchanged. Here we point the same update rule at a full college basketball season, then back-test it to see how well one number predicts the sport. Basketball, with its ~30-game schedules, gives Elo far more data to work with than football does. Full code: scripts/cbb-elo-rating-python.py.
The same engine, new data
Identical math: expected win probability from the rating gap, then nudge by K * (actual - expected). We tune two knobs for hoops — a slightly smaller K = 28 (more games means each one should move the needle less) and a +60 Elo home-court bump (neutral-site tournament games get none):
import sportsdataverse.mbb as mbb
df = mbb.load_mbb_schedule(seasons=[2025]).to_pandas().sort_values("date")
elo = {}
for g in df.itertuples():
    rh, ra = elo.get(g.home_id, 1500), elo.get(g.away_id, 1500)
    adj = 0 if g.neutral_site else 60
    eh  = 1 / (1 + 10 ** (((ra) - (rh + adj)) / 400))
    hw  = 1 if g.home_score > g.away_score else 0
    elo[g.home_id] = rh + 28 * (hw - eh)
elo[g.away_id] = ra + 28 * ((1 - hw) - (1 - eh))Back-test it
As we build, we tally whether the higher pre-game rating won — an honest, in-flight measure of predictiveness across thousands of games.
The result
6292 games. Back-test winner accuracy: 72.1%

Top 15 by Elo:
 1  Florida Gators        1829     6  Michigan State    1732
 2  Houston Cougars       1807     7  St. John's        1732
 3  Duke Blue Devils      1785     8  Drake Bulldogs    1728
 4  Auburn Tigers         1754     9  Chattanooga Mocs  1724
 5  UC San Diego Tritons  1733    10  Tennessee Vols    1722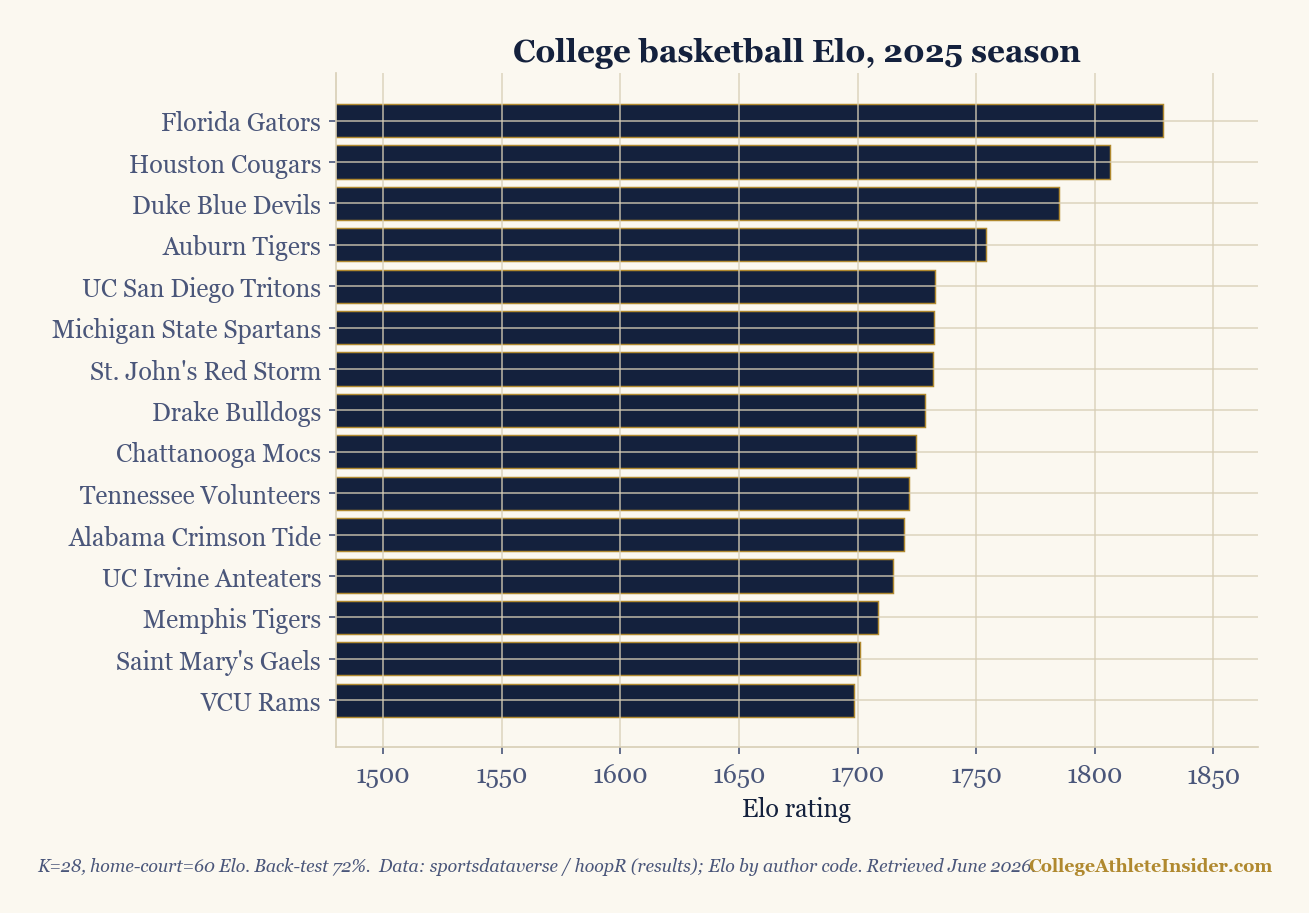
Two things to notice. First, 72% back-test accuracy — even better than football, because more games per team make ratings more stable. Second, the top four (Florida, Houston, Duke, Auburn) were the actual Final Four — your homemade rating found them. But look closer and you'll spot Elo's blind spot: teams like UC San Diego, Drake, and Chattanooga rank surprisingly high. They piled up wins, but mostly against weaker mid-major schedules, and pure Elo doesn't fully discount that. The lesson: Elo rewards winning; it doesn't deeply weigh whom you beat. For that, you want the adjusted-efficiency approach, which explicitly corrects for opponent quality.
Elo vs. adjusted efficiency
- Elo is a win/loss model — fast, intuitive, great at prediction, but it overrates teams that beat up on weak schedules.
- Adjusted efficiency uses scoring margin per possession and explicitly adjusts for opponents — better at separating the genuinely elite from the merely undefeated-against-nobody.
- Use both. When they disagree (a high-Elo, modest-efficiency mid-major), you've found a team to watch in March — see what upsets have in common.
Tune and extend
- Back-test your knobs. Try K of 20, 28, 40 and keep what predicts best on held-out games.
- Margin multiplier (capped) so blowouts move Elo more than buzzer-beaters.
- Women's game: swap
mbbforwbb— same code, same season convention.
Try it yourself
Put the formula from this piece to work on your own numbers. It runs entirely in your browser — nothing is sent anywhere. For the full set, see the Calculators hub.
Elo win probability
Give the rating gap between two teams and get the favorite's win probability from the Elo logistic. Add any home-field bonus to the home rating before you take the difference.
Pure math on the numbers you enter. Nothing is fetched and no real team, player, or result is named or invented.
Sources & further reading
- Background reading: Chapter 18: Game Outcome Prediction, a free textbook chapter at DataField.dev.
- sportsdataverse / hoopR — sportsdataverse.org
- Companion code:
scripts/cbb-elo-rating-python.py - Related: Football Elo · Adjusted efficiency