Raw offensive and defensive efficiency — points scored and allowed per 100 possessions — are the right units for basketball. But they're not fair until you adjust for the opponent: scoring 110 against the best defense in the country is worth more than 110 against a sieve. Opponent-adjusted efficiency is the engine behind every serious rating system, and it's just one idea repeated until the numbers settle. Let's build it. Full code: scripts/cbb-adjusted-efficiency-python.py.
Start with raw efficiency
For each team-game, estimate possessions and compute efficiency on both ends:
poss    = FGA - OREB + TOV + 0.475 * FTA
off_eff = 100 * team_score / poss
def_eff = 100 * opponent_score / poss
Average those over a season and you have raw ratings. The problem: they don't know schedule strength. Now we fix that.
The iterative adjustment
The trick is circular in the best way. A team's adjusted offense is its raw offense, corrected for how good each opponent's defense was — but "how good each defense was" is itself an adjusted number. So you guess, then refine:
L = league_average_efficiency
for _ in range(12):                 # repeat until stable
    for t in teams:
        adjO[t] = mean( off_eff_g - (adjD[opp] - L)  for each game g )
        adjD[t] = mean( def_eff_g - (adjO[opp] - L)  for each game g )
AdjEM = adjO - adjD # net ratingRead the adjustment literally: if you scored 108 (off_eff_g) against a defense that's 6 points better than average (adjD[opp] - L = -6), your adjusted offense for that game is 108 - (-6) = 114. You get credit for scoring on a tough defense.
The result
On the 2024-25 men's season, the iteration lands exactly where the public ratings did:
League efficiency L = 106.0 pts/100. Top by adjusted margin:
 1 Duke           +47.6  (AdjO 132.9 / AdjD 85.3)
 2 Houston        +45.2  (AdjO 126.5 / AdjD 81.3)
 3 Auburn         +43.2  (AdjO 130.9 / AdjD 87.8)
 4 Florida        +41.8  (AdjO 129.6 / AdjD 87.8)
 5 Tennessee      +38.0  (AdjO 123.3 / AdjD 85.3)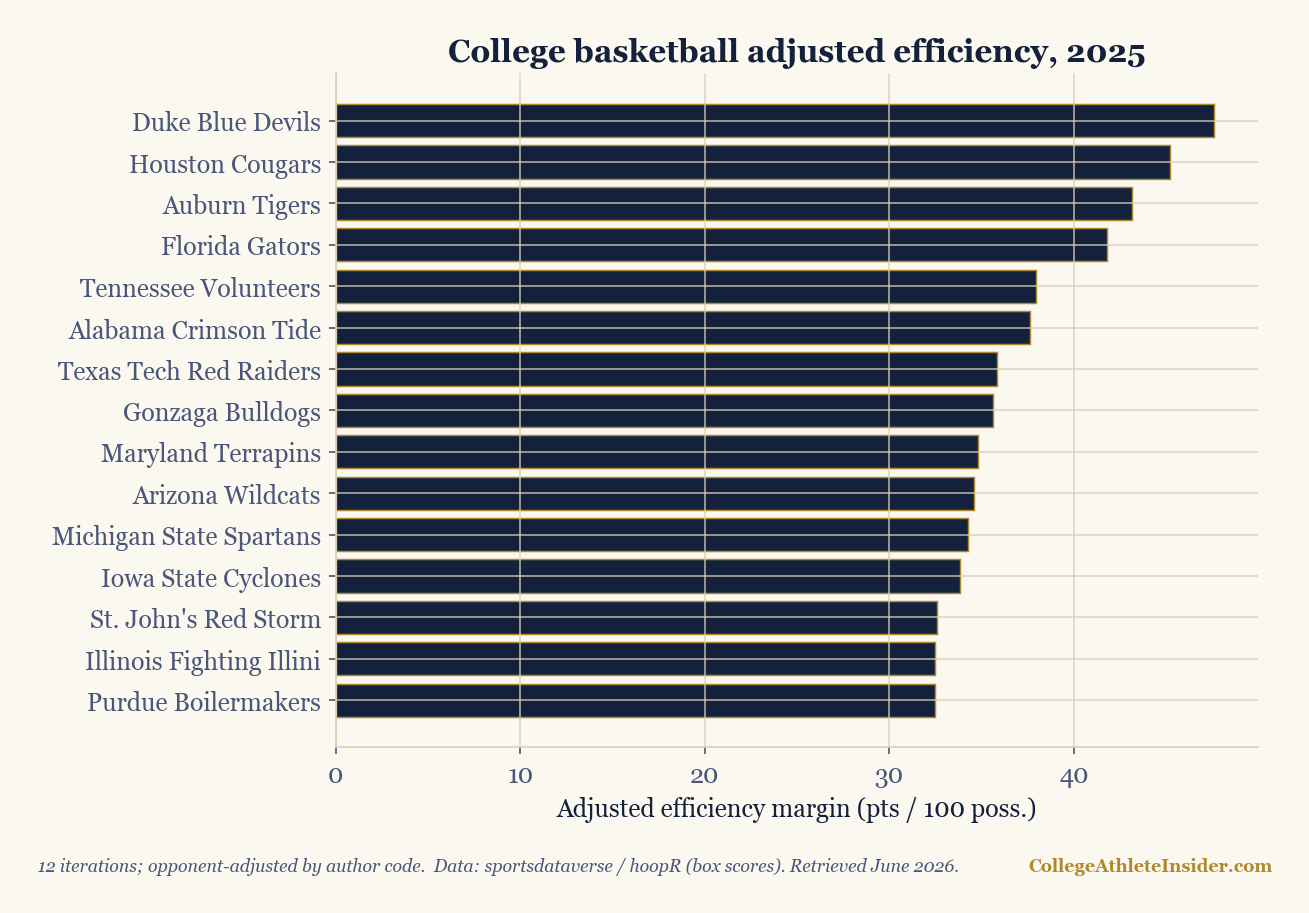
Those four at the top were the actual national semifinalists — your homemade rating found them with a dozen lines of arithmetic. Note that Duke leads on adjusted margin even though Florida won the title: like Elo, this rates the season's quality, not the bracket's outcome. The league average lands at exactly 106 points per 100, the natural yardstick everything is measured against.
Refinements
- Home-court. Adjust each game's efficiency for venue before averaging (a few points per 100).
- Recency & weighting. Down-weight blowouts and early-season games.
- Tempo-free by design. Because everything is per-100, fast and slow teams compare fairly — see tempo profiles.
- Women's game: swap
mbbforwbb; identical code.
This is the same logic as football's spreadsheet ranking, just in possession units. Once you've built it, no "power ranking" is a black box to you again.
Sources & further reading
- Chapter 3: Python for Sports Analytics covers the foundations; it’s free to read at DataField.dev.
- sportsdataverse / hoopR — sportsdataverse.org
- Bart Torvik's T-Rank — barttorvik.com (a public reference rating)
- Companion code:
scripts/cbb-adjusted-efficiency-python.py - Related: The four factors · Why adjust at all