An Elo rating gives you a number for each team. Logistic regression turns the difference between two teams' numbers into a calibrated win probability — and lets you measure exactly how predictive your rating is. It's the workhorse model of sports prediction, and you can build it with nothing but numpy. Full code: scripts/predict-games-logistic-regression-python.py.
The idea
We want a function that maps "how much better is the home team?" to "probability the home team wins." The logistic (sigmoid) function does exactly that — it squashes any number into the 0-to-1 range:
p = 1 / (1 + exp(-(b0 + b1 * x)))Our feature x is the pre-game Elo difference (home rating + home-field, minus away rating), which we compute on the fly with the Elo engine. We fit the two coefficients b0 and b1 by gradient descent, training on the early season and testing on the late season so we're honestly measuring prediction, not memorization.
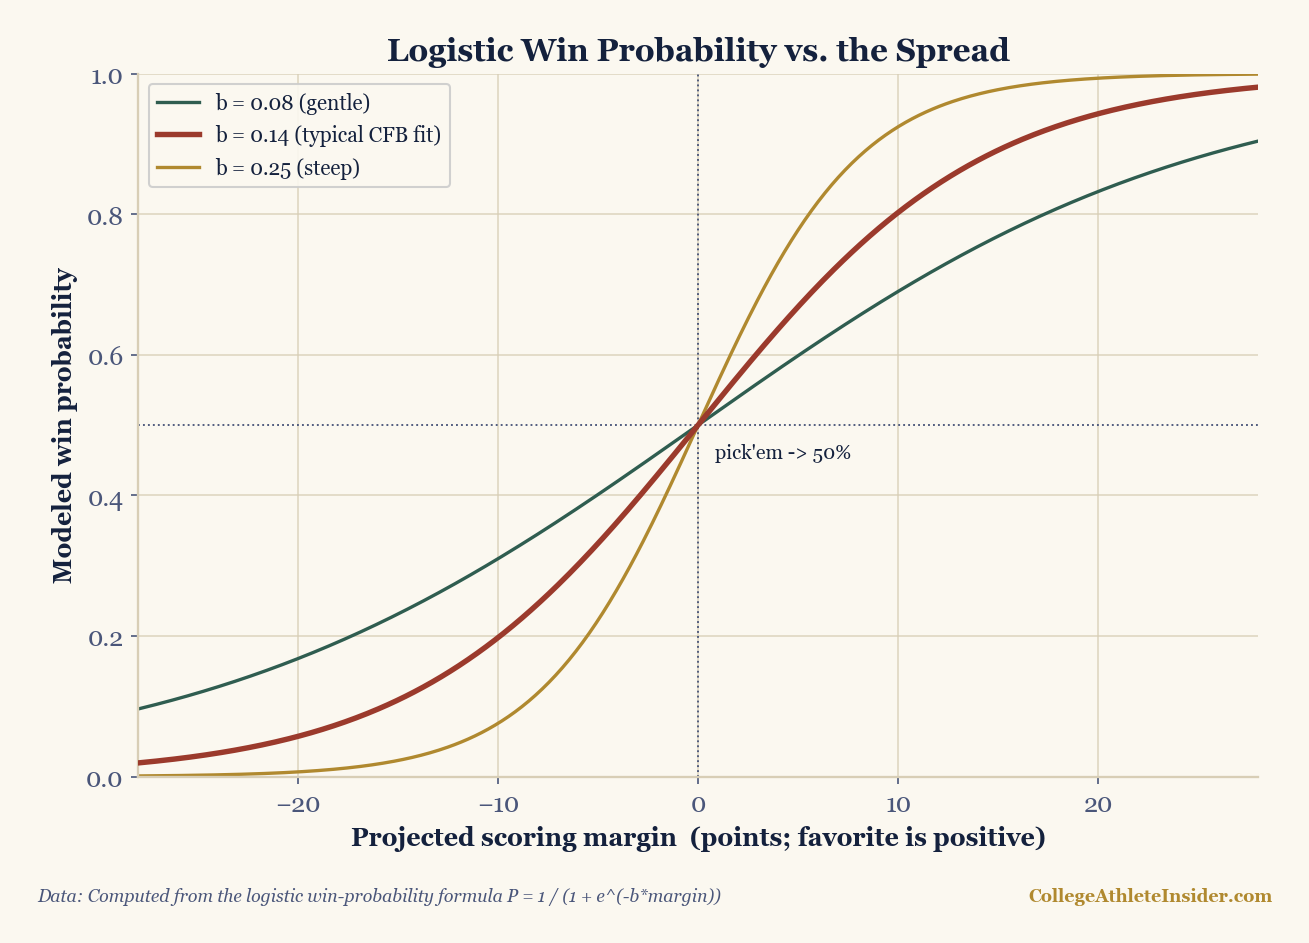
b1 makes the curve steeper. Computed from the logistic win-probability formula P = 1 / (1 + e^(-b*margin)).Fit it with numpy
import numpy as np
xs = (x - x.mean()) / x.std()         # standardize the feature
b0 = b1 = 0.0
for _ in range(4000):                 # gradient descent
    p = 1 / (1 + np.exp(-(b0 + b1 * xs[train])))
    b0 -= 0.3 * np.mean(p - y[train])
b1 -= 0.3 * np.mean((p - y[train]) * xs[train])The result
n=873  train(wk<=10)=626  test(wk>10)=247
Train accuracy: 70.6%   Test accuracy: 67.2%
  +  0 Elo edge -> home win prob 47%
  +100 Elo edge -> home win prob 75%
  +200 Elo edge -> home win prob 91%
  +300 Elo edge -> home win prob 97%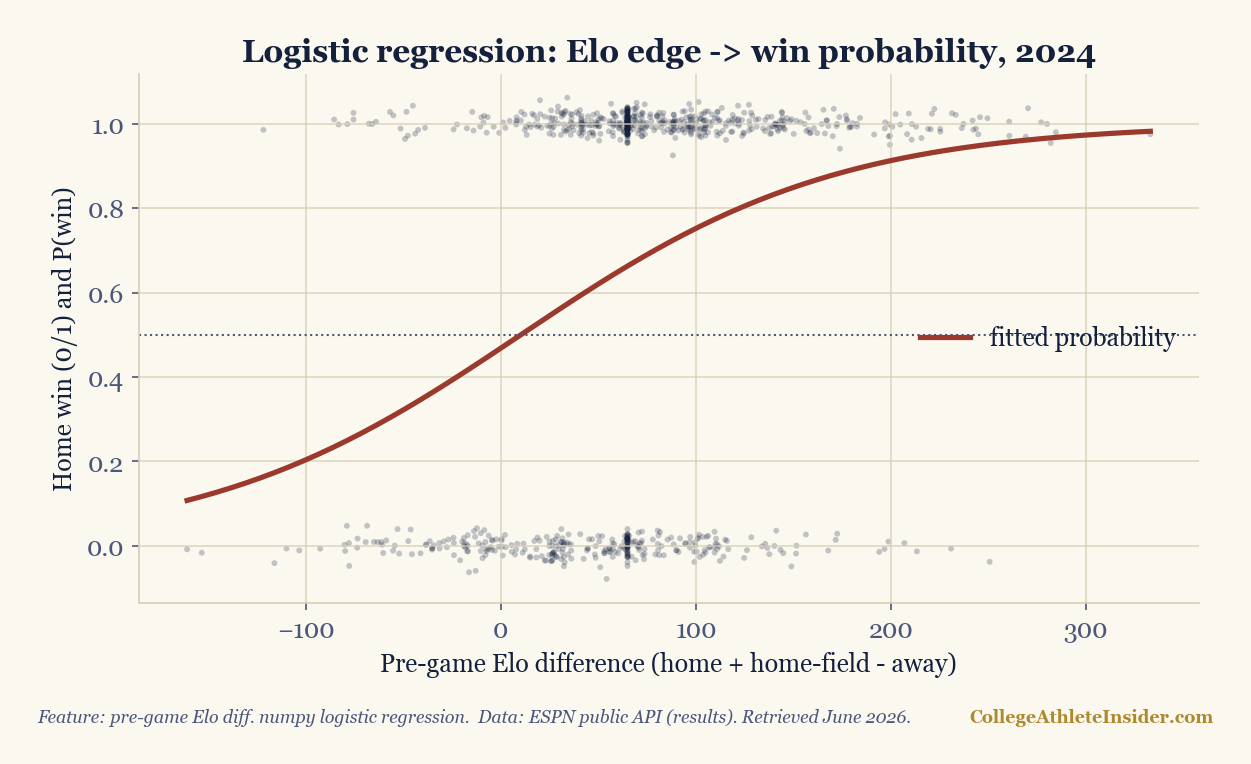
The model's value isn't just the 67% out-of-sample accuracy (held-out games it never trained on) — it's the calibration. It translates an abstract rating gap into plain English: a +100 Elo edge means about a 75% chance to win; +200 pushes it to 91%. And notice the +0 row reads 47%, not 50% — on a true neutral, with no rating edge, the "home" team here is slightly below even because home-field was already folded into the feature. The model is telling you something honest about the data.
Why this matters
- Probabilities, not picks. "75%" is far more useful than "Team A wins." It lets you find games the market or the bracket misprices.
- Test, don't trust. Always hold out games (we trained on weeks ≤10, tested on later). Train accuracy (70.6%) beating test (67.2%) is normal — the gap is the model's optimism.
- Add features. Toss in rest days, travel distance, or pace; logistic regression handles many features with the same math.
Sources & further reading
- Free textbook: Chapter 18: Game Outcome Prediction — the theory behind this, at DataField.dev.
- ESPN public API (results) — via
scripts/_cfb_season.py - Companion code:
scripts/predict-games-logistic-regression-python.py - Related: Build the Elo feature · Display win probability