Our success-rate explainer computed the stat by hand from a single drive. This tutorial scales that up to a whole season, automatically, by pulling every game a team played and scoring every snap. It's the natural next step from one drive to a real, reproducible season number. Full code: scripts/cfb-team-success-rate-season-python.py.
The success rule, in code
A play succeeds if it gains enough of the yards to go: 50% on 1st down, 70% on 2nd, 100% on 3rd or 4th.
def successful(down, dist, gain):
    if dist <= 0:
        return gain > 0
    return gain >= {1: 0.5, 2: 0.7}.get(down, 1.0) * dist
We also need to count only real scrimmage plays — runs, passes, sacks, scrambles, turnovers — and skip punts, kicks, penalties, and clock plays.
Pull a whole season
ESPN's public API gives a team's schedule (with event ids), and each game's summary has the drive-by-drive play list. Loop over the schedule, then over the plays, keeping only the ones run by our team:
BASE = "https://site.api.espn.com/apis/site/v2/sports/football/college-football"
sched = get(f"{BASE}/teams/194/schedule?season=2024")     # 194 = Ohio State
for event in completed_games(sched):
    s = get(f"{BASE}/summary?event={event}")
    for drive in s["drives"]["previous"]:
        if drive["team"]["id"] != "194":      # only our offense
            continue
        for p in drive["plays"]:
            d = p["start"]["down"]
            if d in (1,2,3,4) and is_scrimmage(p["type"]["text"]):
                tally(d, successful(d, p["start"]["distance"], p["statYardage"]))
The result
Ohio State 2024: 10 games, 628 scrimmage plays.
Overall success rate: 47.6%
  1 down: 48.2%  (135/280)
  2 down: 46.0%  (91/198)
  3 down: 44.8%  (56/125)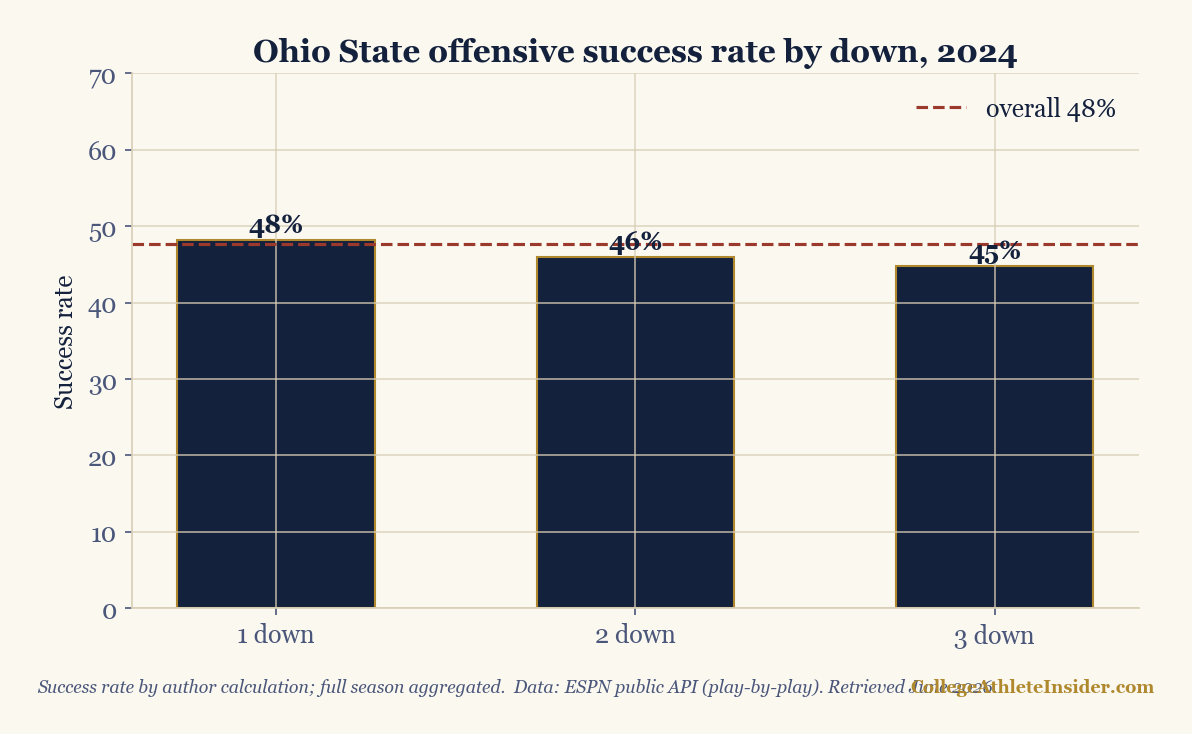
An overall 47.6% success rate is excellent — championship-offense territory (the rough rule of thumb is that the mid-40s and up is good). Notice the descent by down: the bar slips from 48% on first down to 45% on third, because third down demands 100% of the distance. That shape is universal; what separates great offenses is staying ahead of the chains so third downs are short.
Notes and extensions
- Be polite. A season is ~12-15 summary calls per team. Cache them (see the caching tutorial) so re-runs don't re-hit ESPN.
- Filter garbage time for a truer number — that's the next tutorial, cleaning play-by-play.
- Split by run/pass to find whether a team is more efficient on the ground or through the air.
- Defense too: flip the filter to drives where your team is not on offense to get success rate allowed.
Sources & further reading
- Background reading: Chapter 3: Python for Sports Analytics, a free textbook chapter at DataField.dev.
- ESPN public API (team schedule + play-by-play)
- Companion code:
scripts/cfb-team-success-rate-season-python.py - Related: Success rate & EPA explained · Filter garbage time